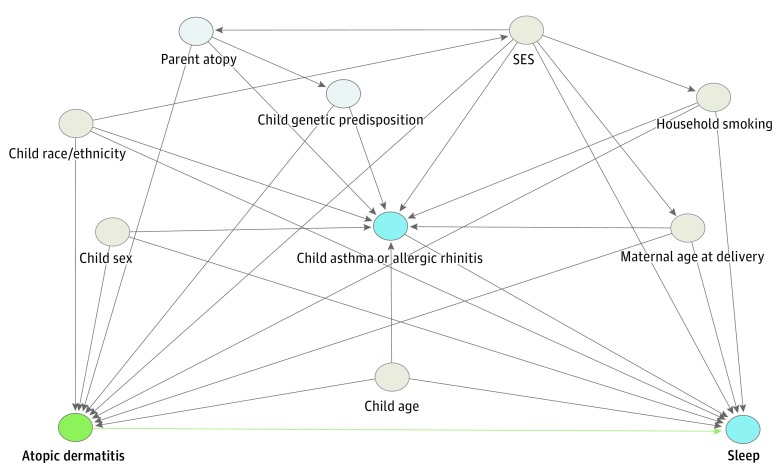
Figure 1. Directed Acyclic Graph.
A directed acyclic graph represents associations between covariates and primary exposure and outcome. Gray circles represent ancestors of the exposure and outcome (ie, confounders), blue circles represent ancestors of the outcome (ie, causal determinants of the outcome), and light blue circles represent unobserved (ie, latent) variables. Green lines represent causal paths, and gray lines represent biasing paths. The minimally sufficient adjustment set represents covariates such that the adjustment for this set of variables will minimize confounding bias when estimating the association between the exposure and the outcome. The minimally sufficient adjustment set was determined using the DAGitty software.21 Child comorbid asthma or allergic rhinitis was considered to be a collider, which was appropriately accounted for by adjusting for additional variables contained on the backdoor paths shared by this collider. The final minimally sufficient adjustment set comprised child sex, age, race/ethnicity, and comorbid asthma or allergic rhinitis; maternal age at delivery; socioeconomic status (SES); and household smoking exposure.

