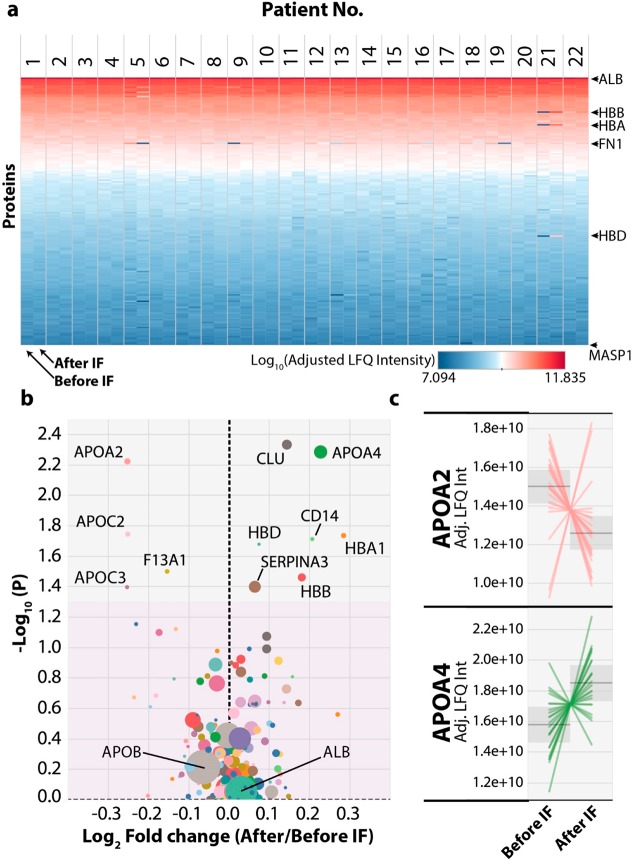
Figure 2.
Intermittent fasting induces changes in protein abundance in human plasma. (a) Heat map showing each protein ranked by its total log10 adjusted Label-Free Quantitation (Adj. LFQ) intensity (y-axis) versus the data for each participant from both before and after the IF intervention. Blue colors represent low abundance and red colors high abundance. Only complete cases were used; any protein with a missing value in any sample was excluded. (b) Volcano plot of plasma protein abundance changes after IF were plotted with the y-axis showing the −log10 (p-value, paired) and the x-axis showing the log2 fold-change of protein abundance (after IF/before IF) calculated from the LFQ intensity values. The gray area denotes significant (p < 0.05) changes with IF and the pink area denotes nonsignificant (p > 0.05) changes. The size of each circle represents the minimum number of razor and unique peptides across all participants, larger size indicates more razor and unique peptides. (c) Line graphs for the two most significant up and down regulated proteins after the IF intervention were plotted with the y-axis showing the Adj. LFQ intensity and each line representing one participant’s response.

