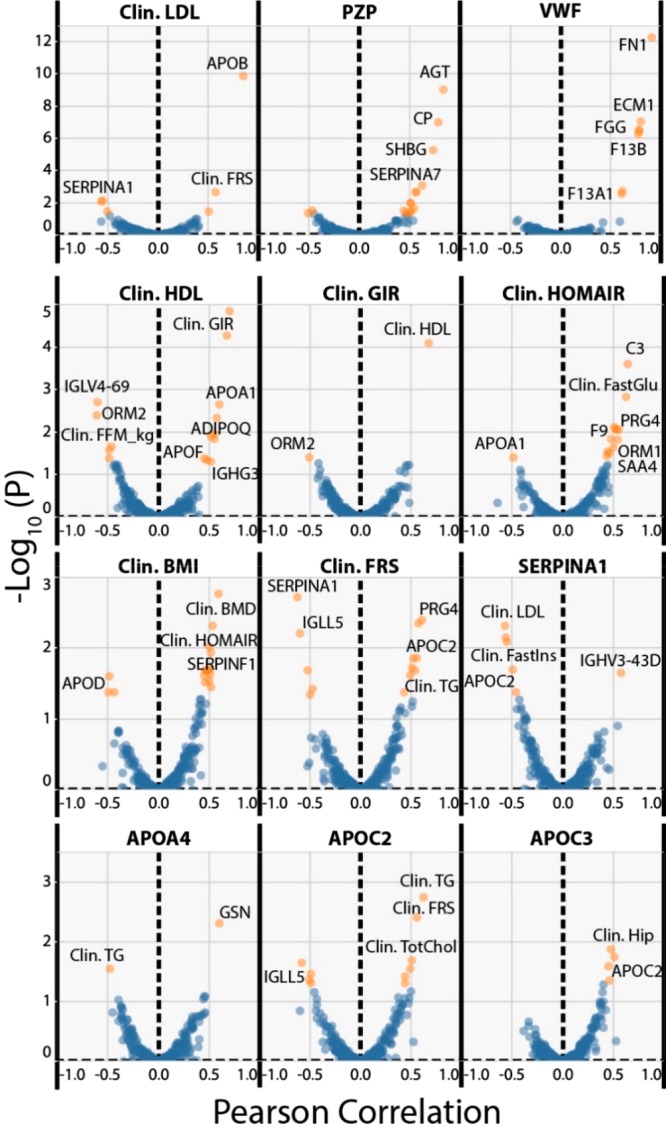
Figure 3.

Correlation analysis of plasma protein abundance versus clinical parameters monitored in the PREFER trial. Data derived from all detected proteins and all clinical parameters were correlated against each other across all 44 participant samples, disregarding any grouping information. Correlations were calculated using the Pearson’s correlation coefficient and the resulting p-values were subjected to Benjamini–Hochberg correction. The y-axis of each plot shows the −log10 (corrected p-value) versus the Pearson correlation. Values in blue are insignificant (FDR > 5%) and values in orange are significant (FDR < 5%). Each measure starting with Clin. (Clinical) represents an individual clinical measurement. Proteins are indicated by their corresponding gene name.
