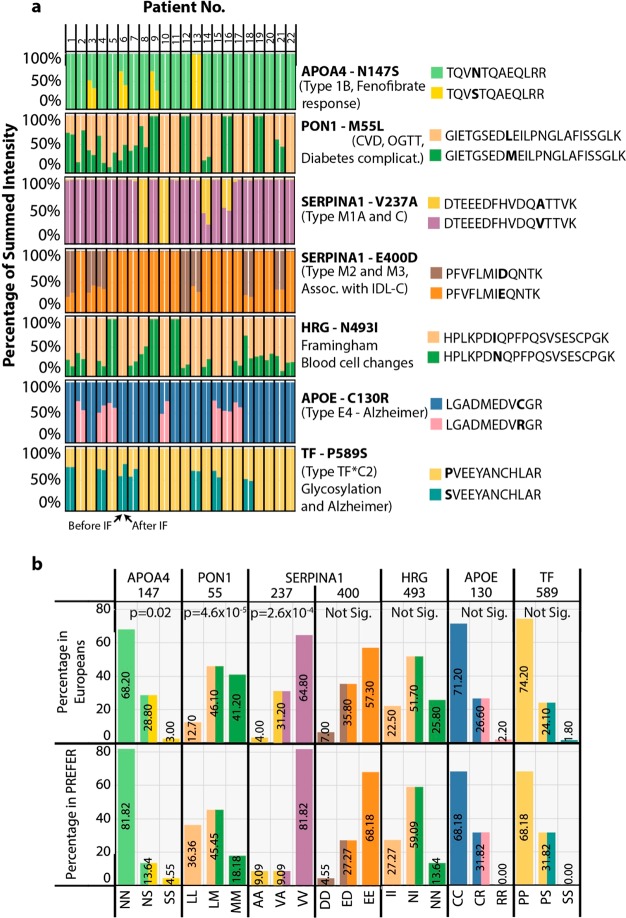
Figure 4.
Detection of clinically relevant natural protein variants in the PREFER plasma proteomes. Mass spectrometry-based proteomics data was reanalyzed using a modified plasma-specific protein database containing all known forms of naturally occurring clinically-relevant variants. (a) Bar plot for each protein variant where the y-axis shows the summed intensity of peptides derived from each allele as a percentage of total, and the x-axis shows the 44 participant samples with one bar per sample. The gene name for each variant and its position in the protein are indicated in bold to the right of each plot. Also shown are the associated human phenotypes. Peptides from each allele are shown in different colors on the same plot and correspond to each legend shown on the right. (b) Bar plot showing either the frequency of the genotype in the European population sampled by the 1000Genomes study, or the frequency of the corresponding peptide variants in the PREFER plasma proteome samples. The y-axis shows the frequency in percentage of total, and the x-axis shows the corresponding genomic allele and peptide variant combinations. A comparison of the frequencies for each allele was made using Fisher’s Exact Test, which is shown at the top of the plot.

