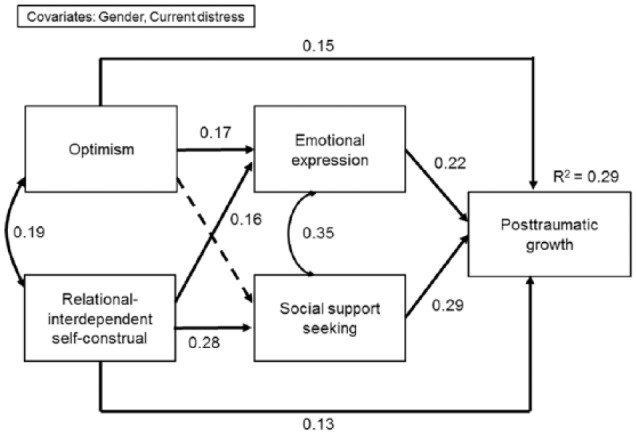
Figure 1.

A path model illustrating the relationships among individual differences (relational-interdependent self-construal and optimism), coping strategies (emotional expression and social support seeking), and posttraumatic growth.
Values shown are standardized path coefficients. Solid lines represent significant paths in the hypothesized model (all ps < .01). The broken line indicates a non-significant path in the hypothesized model (p > .05), which was removed from the final model.
