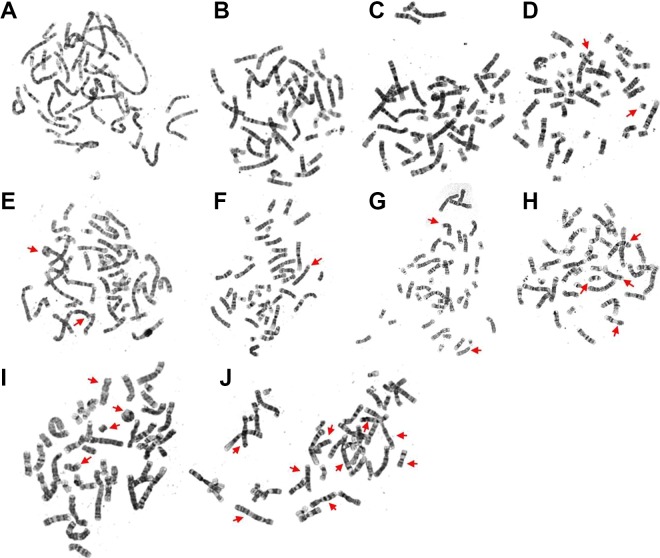
Figure 1.
Chromosomal variations induced by different radiation doses. The arrows indicate the translocation and chromosome aberrations, which were observed at various radiation dose as follows: (A and B): 0 Gy; (C and D): 0.5 Gy; (E and F): 1 Gy; (G and H): 2.5 Gy; (I and J): 5 Gy. The number (count) of chromosome aberrations was as follows: 0 for (A and B), 2 for (C and D), 3 for (E and F), 6 for (G and H), and 12 for (I and J).

