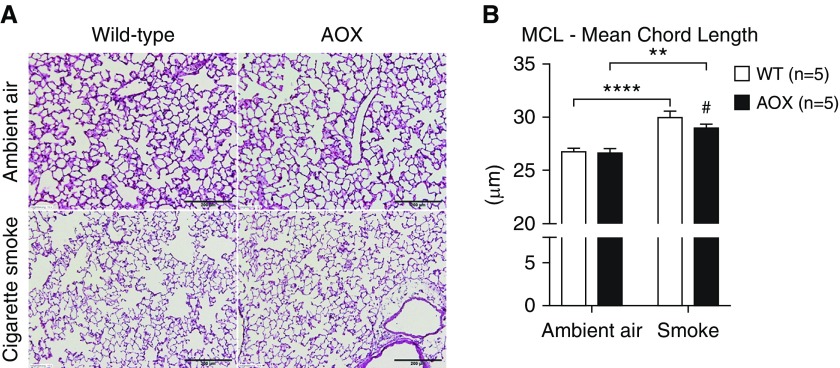
Figure 2.
Stereological analysis of lung tissue. (A) Representative tissue slices (hematoxylin and eosin stained). (B) Statistical analysis of mean chord length (MCL). All data are shown as mean ± SEM; **P < 0.005 and ****P < 0.0001 by two-way ANOVA; #P < 0.05 by paired t test on smoke-exposed groups. Scale bars: 200 μm.

