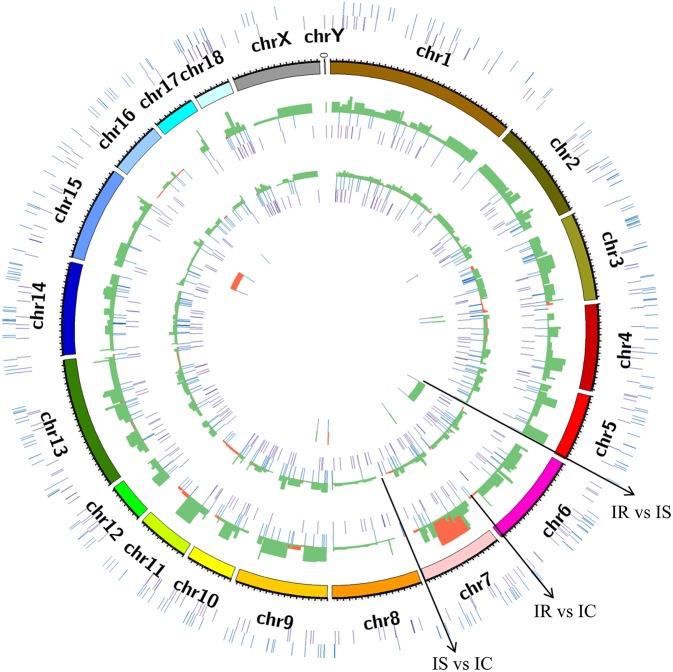
Figure 5.
Circular chromosome distribution of lncRNA identified in piglet ileums across the reference genome and different comparison groups. The outermost circle displays the sum of novel and annotated lncRNAs identified in three comparison groups. The second circle displays pig chromosomes scale. The remaining three circles display the novel and annotated lncRNAs in IR vs. IC, IS vs. IC, and IR vs. IS, respectively. Purple: novel lncRNA; Blue: annotated lncRNA; Red: the up-regulated lncRNA; Green: the down-regulated lncRNA, the red and green were plotted by the log2 (fold change) among IR vs. IC, IS vs. IC, and IR vs. IS groups.

