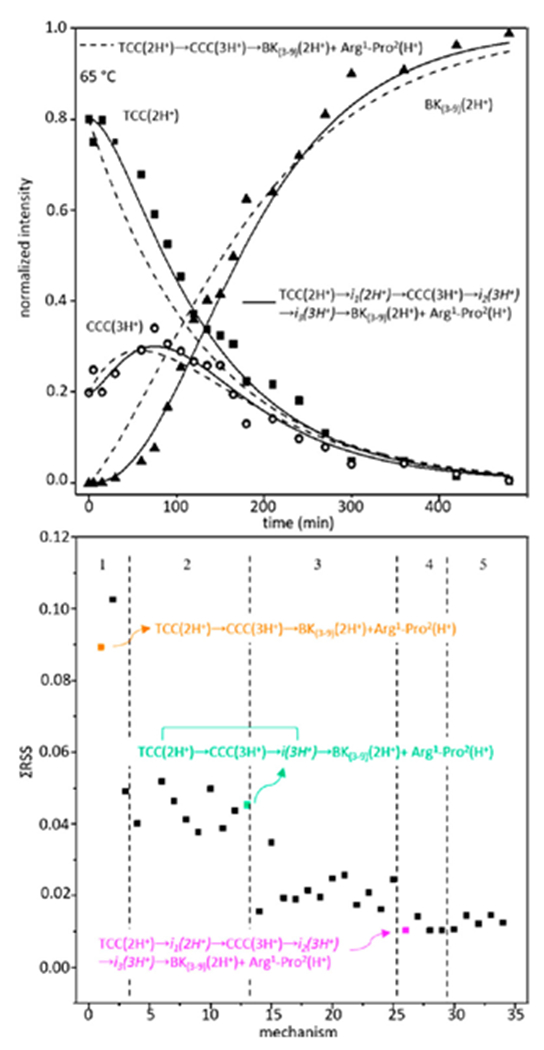
Figure 3.

Kinetics data shown at 65 °C (top). Two models are shown with the solid line representing TCC(2H+) → i1(2H+) → CCC(3H+) → i2(3H+) → i3(3H+) →BK(3-9)(2H+)+Arg1-Pro2(H+), among the statistically best models, and the dashed line representing TCC(2H+) → CCC(3H+) → BK(3-9)(2H+)+Arg1-Pro2(H+), the simplest model. Bottom panel shows residual sums of squares values for each model, separated by dashed lines corresponding to 1-5 intermediates. Three example reaction pathways are shown.
