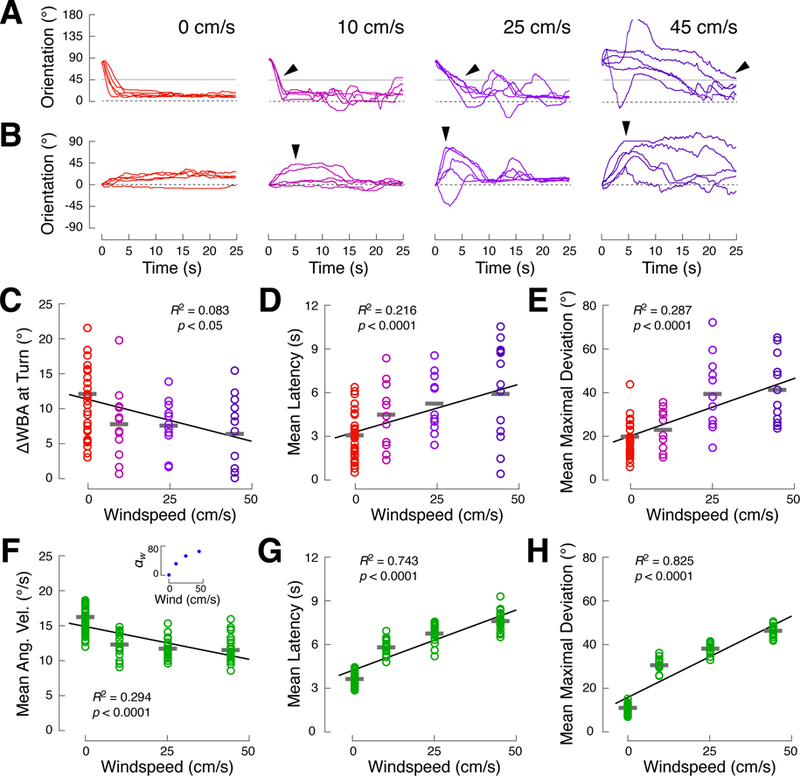
Figure 4. Turn kinetics vary continuously with stimulus intensity.

(A) Slowing of visually-guided turns in the presence of a competing wind stimulus increases with windspeed. Each plot shows 5 trials from single flies beginning at 90°. The leftmost plot represents the vision condition (red), while the right hand plots show the multisensory condition at low (10 cm/s, magenta), medium (25 cm/s, purple, reproduced from Figure 2B), and high (45 cm/s, indigo) wind speeds. Arrows highlight the timing of turns through 45° (gray line).
(B) Transient deviations from 0° (arrows) grow with windspeed. Each plot shows 5 trials from single flies beginning at 0°. Third panel is reprod uced from Figure 2B.
(C-E) Behavioral measures evaluated as a function of windspeed. Each fly was presented with the vision stimulus and one of 3 multisensory condition wind speeds yielding (N = 34, 11, 11, and 12 flies for wind at 0, 10, 25, and 45 cm/s, respectively). Circles: single flies; gray bars: mean across flies. Black lines indicate best linear fits, but behavioral parameters generally change nonlinearly with windspeed.
(C) Mean turn rate through 45° on 90° trials (as in Figure 2C) is negatively correlated with windspeed (R2 = 0.08, p < 0.05), as shown in (A).
(D) Latency to turn through 45° (as in Figure 2C) i s positively correlated with windspeed (R2 = 0.22, p < 0.0001), as shown in (A).
(E) Mean maximal deviation from 0° (as in Figure 2F ) is positively correlated with windspeed (R2 = 0.29, p < 0.0001), as shown in (B).
(F-H) Measures of simulated behavior using the spatiotemporal filtering model (Figure 3A). Each stimulus condition contains data from 20 simulated “flies” (the mean of a 5-trial block, as in Figure 3I). The wind intensity parameter (αw) values corresponding to different wind speeds were found by fitting only this parameter to the wind condition data from the high and low windspeed experiments, above. All other model parameters are unchanged. The inset in panel illustrates the nonlinear relationship between windspeed and the best-fitting αw. See also Figure S7.
(F) Turn rate (as in (C)) is negatively correlated with wind strength in model simulations (R2 = 0.29, p < 0.0001).
(G) Latency to turn (as in (D)) is positively correlated with wind strength in model simulations (R2 = 0.74, p < 0.0001).
(H) Mean maximal deviation from 0° (as in (E)) is p ositively correlated with wind strength in model simulations (R2 = 0.83, p < 0.0001).
