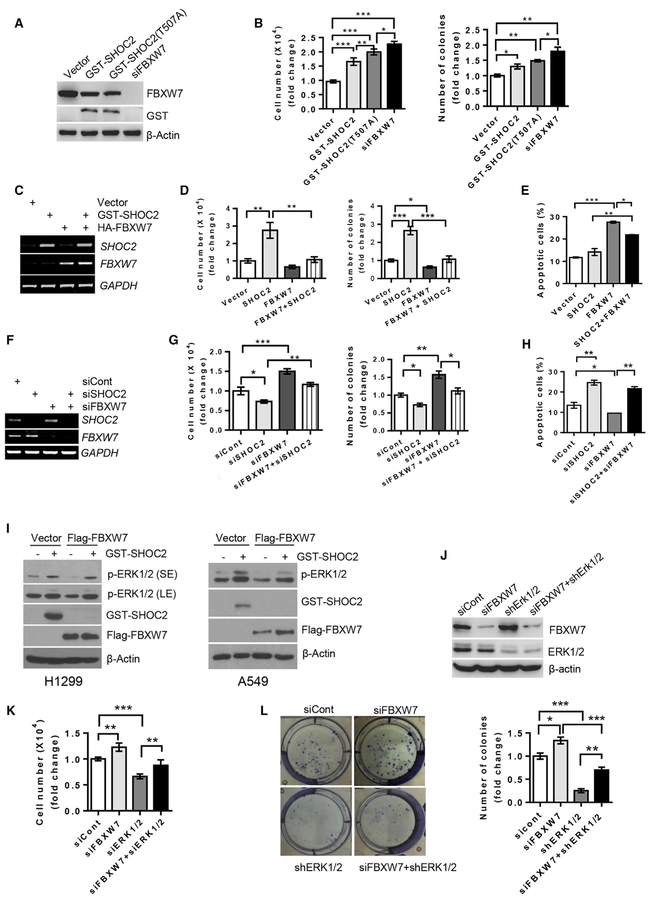
Figure 3. SHOC2 Promotes Cell Growth, Blocked by FBXW7 and ERK Silencing.
(A–H) A549 (A, B, E, and H) or H1299 (C, D, F, and G) cells were transfected with the indicated plasmids or siRNAs. Forty-eight h later, a portion of cells were harvested for RT-PCR or IB analysis (A, C, and F). Another portion was grown for 48 h, cell numbers (left: B, D, and G) were counted, and percentage of apoptotic cells (E and H) were measured. Still other portions were plated into 6-well plates, and colonies with more than 50 cells counted after 9–13 days (right: B, D, and G). The error bars represent SEM from three independent experiments; *p < 0.05, **p < 0.01, and ***p < 0.001.
(I–L) H1299 (I–L) or A549 (I, right) cells were transfected with indicated plasmids or siRNAs and harvested 48 h later for IB (I and J) or counting cell numbers (K) and colonies (L). The error bars represent SEM from three independent experiments; *p < 0.05, **p < 0.01, and ***p < 0.001.

