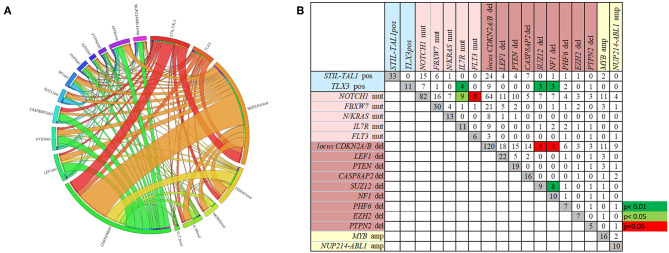
Figure 1.
The frequencies and the concomitance of molecular alterations in 168 pediatric T-ALL cases. (A) Circos plot showing the overall co-occurrence of mutations, rearrangements, and CNA assessed through MLPA. Outer segments proportionally represent the alterations found in T-ALL. Interior lines connecting the outer segments proportionally demonstrate the concomitances among genetic alterations. (B) Number of cases with each molecular alteration in gray squares, and number of cases with concomitances between two alterations in white, green and red squares. Green squares represent positive while the red squares negative associations. Alterations ordered by type of abnormality. Rearrangements in blue, mutations in pink, CNA deletions in brown and amplifications in yellow.

