
Figure 4.
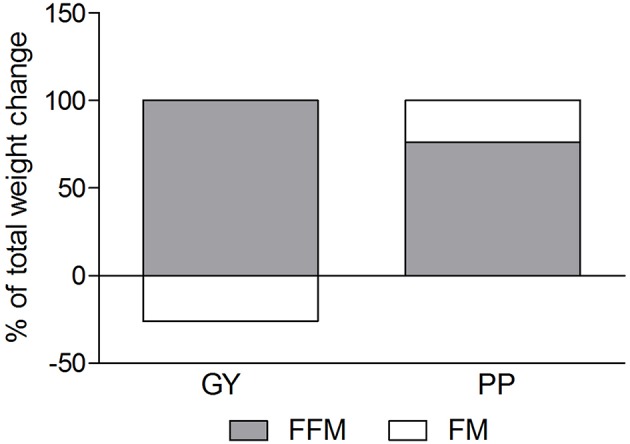
Fat mass and Fat-free mass visually expressed as a percent of total mass change during the intervention for the GY and PP groups (GY = 14, PP = 15).
Official websites use .gov
A
.gov website belongs to an official
government organization in the United States.
Secure .gov websites use HTTPS
A lock (
) or https:// means you've safely
connected to the .gov website. Share sensitive
information only on official, secure websites.
Fat mass and Fat-free mass visually expressed as a percent of total mass change during the intervention for the GY and PP groups (GY = 14, PP = 15).