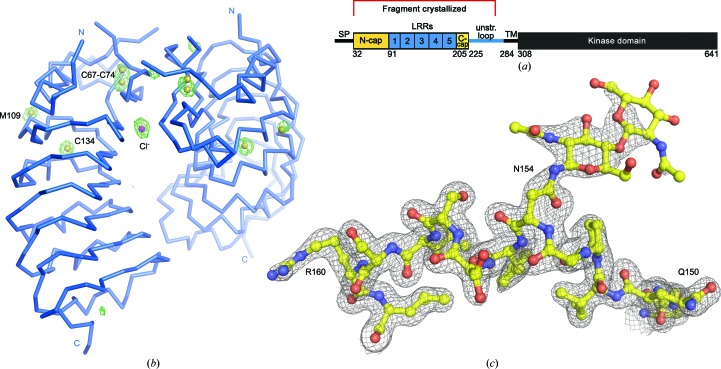
Figure 2.
Structure solution of SOBIR1. (a) Schematic representation of SOBIR1 (SP, signal peptide; TM, transmembrane helix; unstr. loop, unstructured loop; N-cap/C-cap, N/C-terminal capping domain). The fragment crystallized is indicated in red. (b) Cα trace of the SOBIR1 crystallographic dimer (in blue) including a phased anomalous difference map contoured at 5.0σ (green mesh), the eight S atoms (yellow spheres) and a putative chloride anion (magenta). (c) Example region of the SOBIR1 structure, including the N-glycosylated Asn154 (yellow ball-and-stick representation), with the final (2F o − F c) map contoured at 1.2σ.

