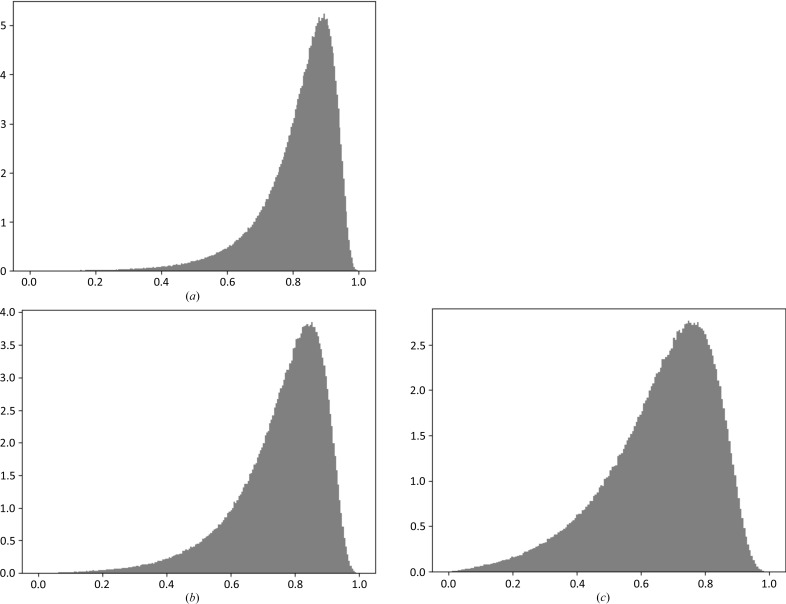
Figure 2.
Resolution- and B-value-dependent peak-height distribution. The SIGD, with parameters α = 3.6, β = 32, corresponds to the model with PDB code 1fce. This model was used to generate peak-height distributions at (a) 3 Å, (b) 2.5 Å and (c) 2 Å.

