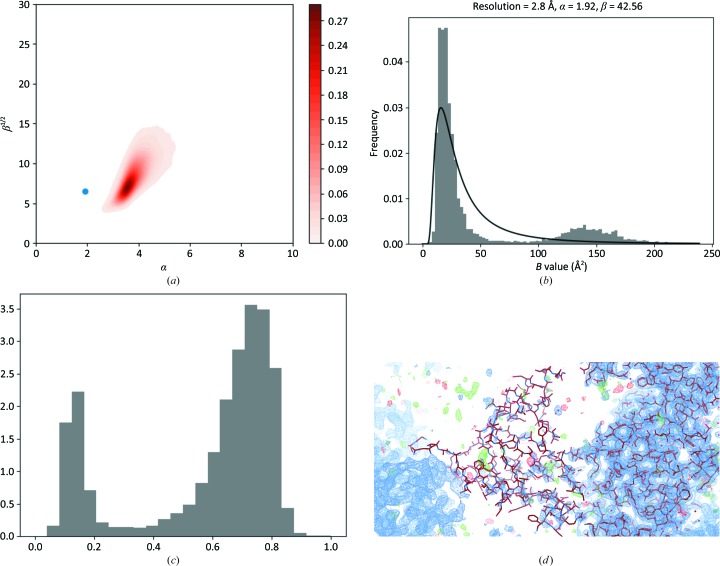
Figure 8.
A multimodal B-value distribution – disordered region: PDB entry 4l39. (a) Parameters of the SIGD for PDB entry 4l39 shown on an α/β plot. (b) The SIGD and B-value distribution. (c) The peak-height distribution. (d) The density map, highlighting the various levels of density for the main part of the model and a small domain. The density was contoured at σ level 1. Coot (Emsley et al., 2010 ▸) was used to produce (d).

