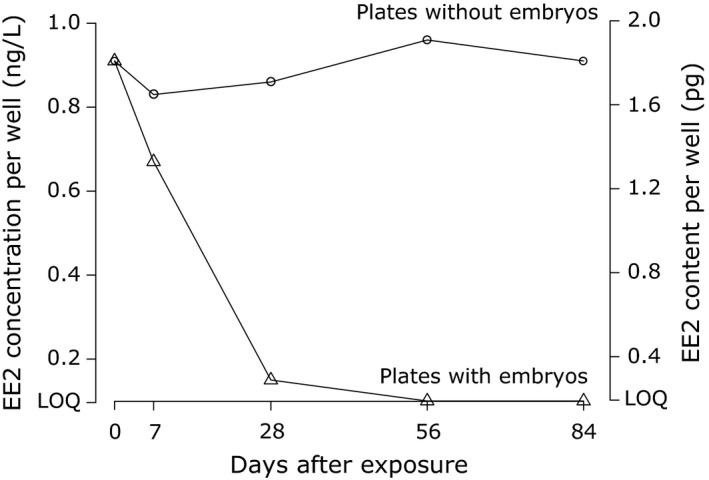
Figure 2.

The persistence of 17α‐ethynylestradiol (EE2) in 24‐well plates with and without embryos across 5 time points. Triangles represent plates with embryos and circles without embryos. Sham‐treatment data points are not shown because they were always below LOQ (0.1 ng/L or a total well content of 0.2 pg). Symbols at LOQ level are present just for orientation; that is, they were below LOQ
