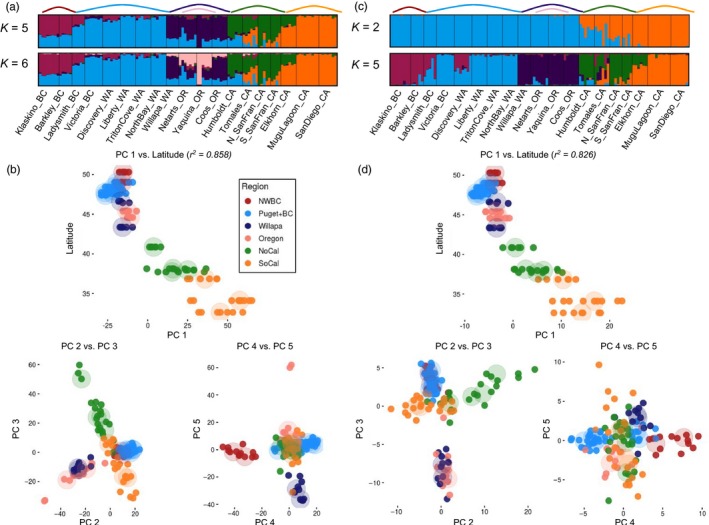
Figure 2.

Population structure results for 19 Ostrea lurida populations using (a,b) neutral loci and (c,d) outlier loci. (a,c) Plots of individual admixture determined using the program STRUCTURE at the K recommended by the ∆K method (K = 5 neutral, K = 2 outlier), as well as at the value of K inferred from PCA (K = 6 neutral, K = 5 outlier). (b,d) Principal component analysis plots for PCs 1–5. PC1 is plotted against latitude of sampling site, then PC2 versus PC3 and PC4 versus PC5. Large transparent circles indicate the centroid of populations. Colors refer to the phylogeographic regions of each population
