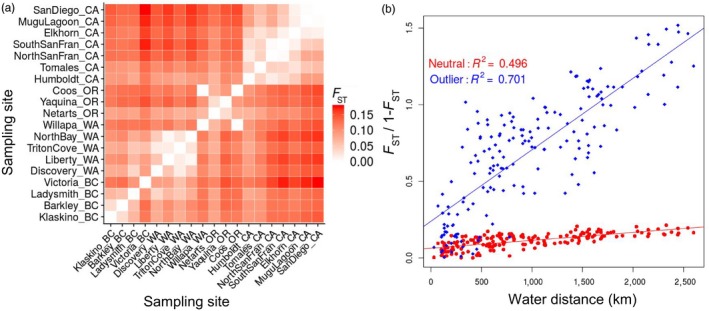
Figure 3.

(a) Heatmap of pairwise F ST values for 19 populations of Ostrea lurida using 13,073 neutral SNPs. Populations are ordered from north to south, starting with Klaskino, BC. (b) Isolation‐by‐distance plot of F ST/1−F ST versus population pairwise coastal water distance. Neutral loci in red circles (p < 0.001) and outlier loci in blue diamonds (p < 0.001)
