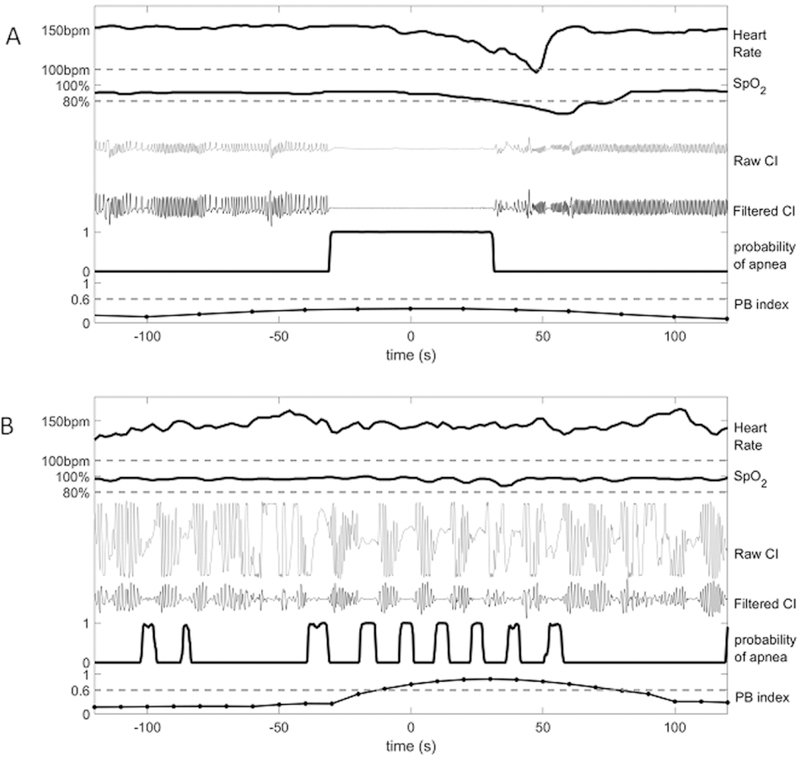
Figure 4.
A quantitative breathing record for an episode of central neonatal apnea (A) and of periodic breathing (B). In each, the top three tracings are as shown on the bedside monitor: heart rate, oxygen saturation (SpO2) and chest impedance (CI). The bottom three time series are generated by numerical algorithms developed at the College of William and Mary whose results were validated clinically: filtered CI, probability of apnea and an index of periodic breathing (PB). In A, the long apnea is accompanied by bradycardia (heart rate 100) and desaturation (SpO2<80%), and the PB index remains below a threshold for detection. In B, the seven regularly spaced apneas lead to neither bradycardia nor desaturation, but the PB index exceeds the threshold for detection.

