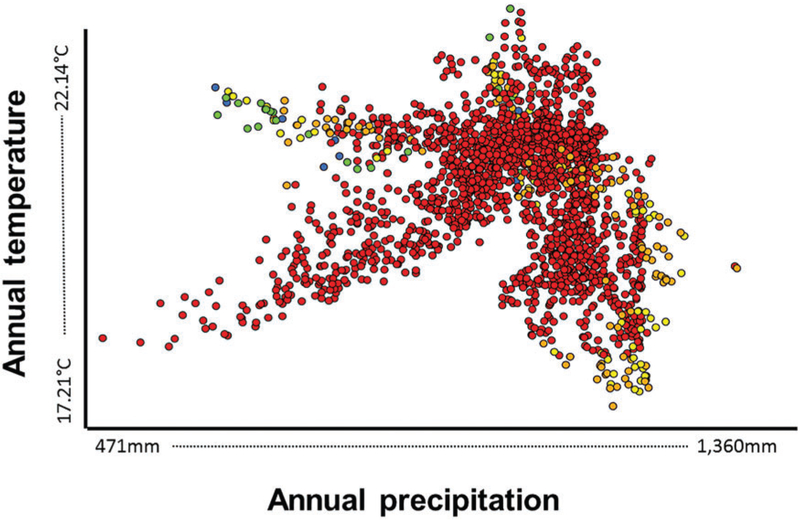
Fig. 3.
Scatterplot showing the distribution of Ae. aegypti occurrences in an environmental space built with annual precipitation (X axis) and mean annual temperature (Y axis). Colors represent the five categories of environmental suitability: very low (blue), low (green), medium (yellow), high (orange), and very high (red).

