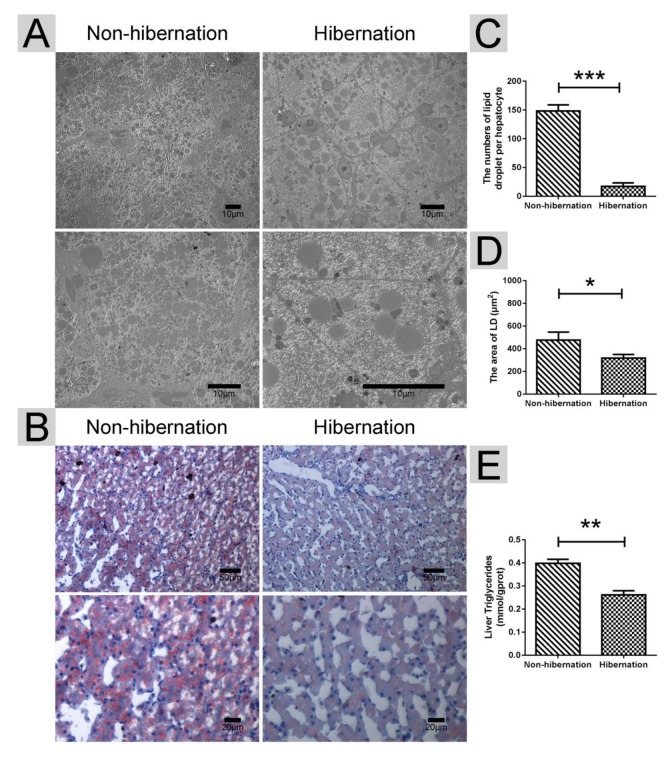
Figure 1.
Differences in the lipid droplet (LD) and triglyceride (TG) contents in the liver during hibernation and non-hibernation group. (A) Transmission electron microscopy (TEM) image of hepatocytes; (B) Oil Red O staining of the liver; (C) Statistics of LD numbers in the hepatic TEM image; (D) Statistics of LD areas; (E) Analysis of TG in the liver.

