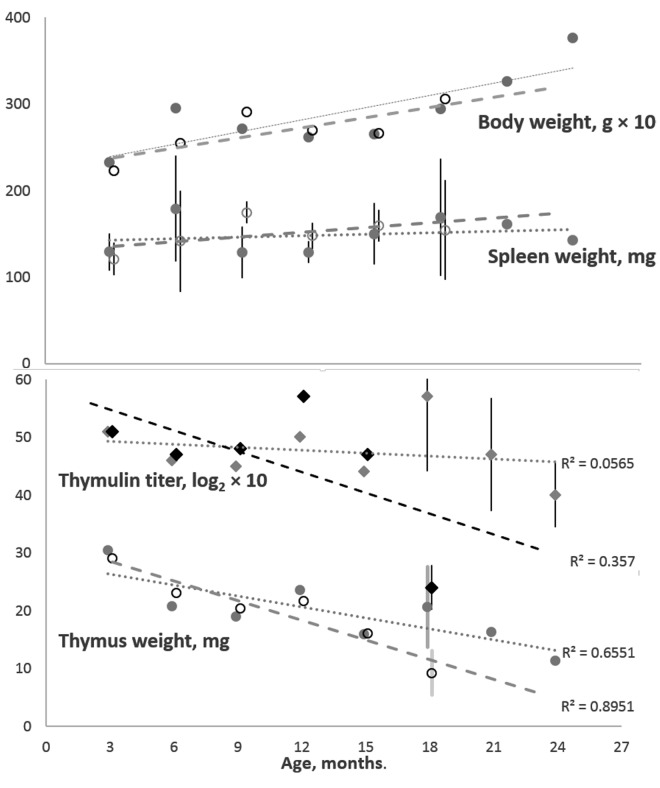
Figure 1.
Body and spleen weights (the upper panel) and thymus weight and serum thymulin titer (the lower panel) in the cohorts of female K14/mIGF1 and WT FVB/N mice. Body weight and thymulin titer data are multiplied by 10 to better accommodate all data to the respective panels. To avoid encumbering, shown are only the 95% confidence intervals that suggest significant differences between K14/mIGF1 and WT FVB/N mice (the lower panel) and the lack of significant differences in the spleen weights of the two strains (the upper panel). K14/mIGF1 mice are presented with dashed lines and open markers, except for thymulin data markers (filled black diamonds). FVB/N mice are presented with dotted lines and filled gray markers. No comparison between K14/mIGF1 and FVB/N data are possible after ages above 18 months because the former mice do not live thus long.

