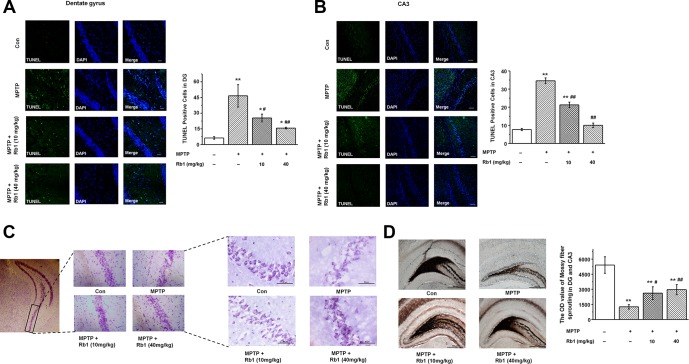
Figure 2.
Rb1 protects hippocampal neurons from death in MPTP-treated mice. (A and B) TUNEL staining showed the apoptosis of hippocampal neurons in the DG and CA3 regions. Scale bar, 30 μm in (A) and 60 μm in (B). (C) Nissl staining of hippocampal neurons in the CA3 regions. Scale bar, 100 μm for the low-power field in the left and 50 μm for the high-power field in the right. (D) Timm staining of mossy fiber in the DG and CA3 regions. Scale bar, 500 μm. n = 10 per group. Results are expressed as the mean ± SEM. **p < 0.01, *p < 0.05 vs. control group; ##p < 0.01, #p < 0.05 vs. MPTP group. Statistical significance was determined by one-way ANOVA and Bonferroni tests as post hoc comparisons.

