Figure 3.
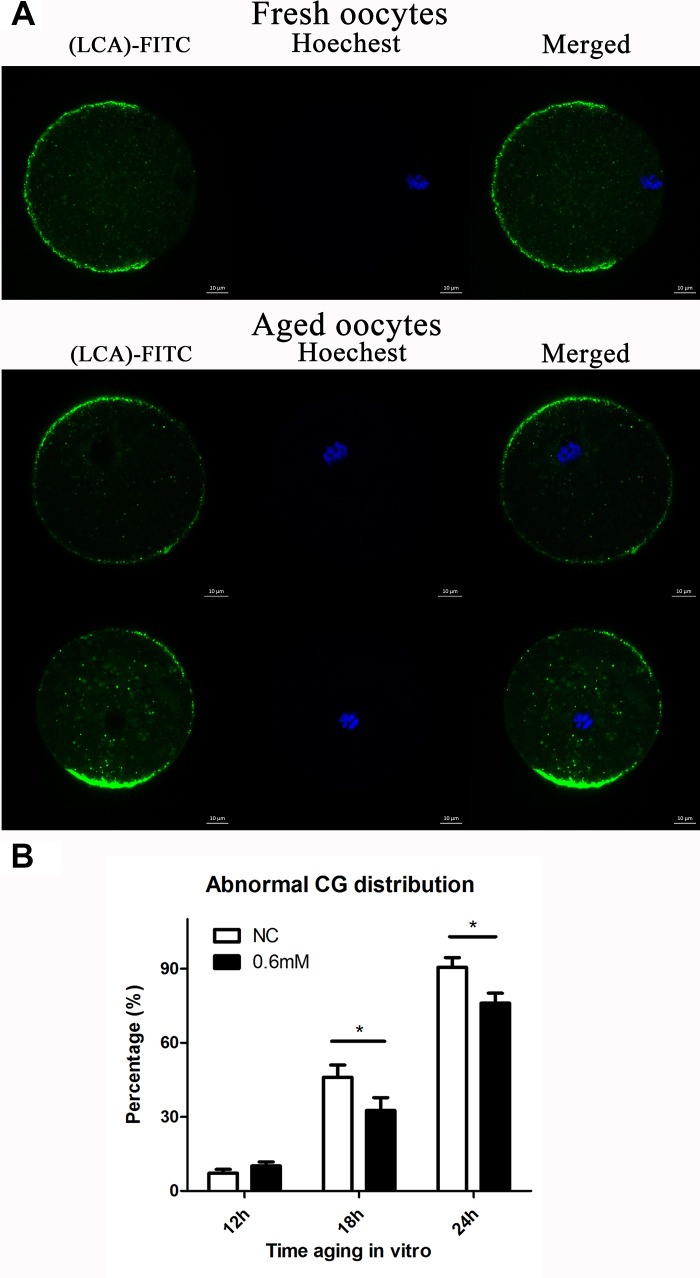
NAC administration maintains the normal distribution of CGs. (A) Different patterns of CG distribution in fresh and aged oocytes. CGs in oocytes were stained with lens culinaris (LCA)-FITC (fluorescein isothiocyanate: green) and chromosomes were stained with Hoechst 33342 (blue). The total number of oocytes in each experiment and the number of oocytes which showed abnormal CG distribution were counted to calculate the percentage of abnormal CG distribution in oocytes. (B) Percentages of abnormal distribution of CGs in oocytes. NC, oocytes treated without NAC. 0.6mM, oocytes treated with 0.6mM NAC. Data are expressed as mean ± SEM of at least 3 independent experiments, and 6 superovulated mice were killed to obtain a minimum of 40 oocytes for each experiment.

