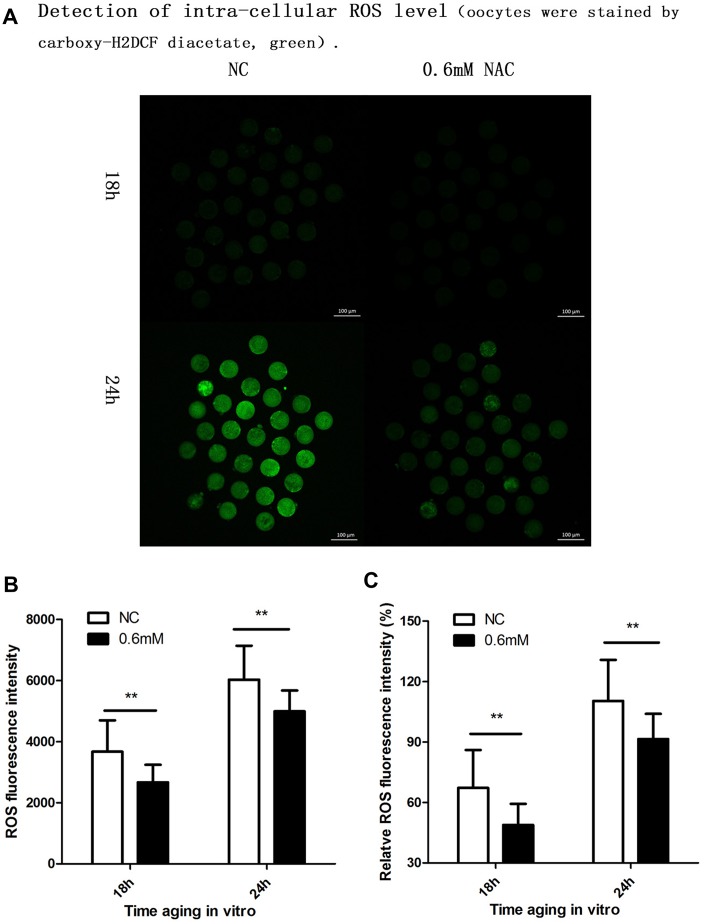
Figure 4.
Supplementation of NAC decreases the intra-cellular ROS level. (A) Representative images of carboxy-H2DCF fluorescence in oocytes. Images were analyzed by a Perkin Elmer precisely Ultra VIEW VOX Confocal Imaging System with the identical fluorescence parameters. NC, control group in which oocytes were not treated with NAC. 0.6mM NAC, oocytes treated with 0.6mM NAC. 18h, 24h: timing of aging in vitro. (B) Quantitative analysis (counts of photons for each oocyte) of fluorescence intensity. The fluorescence intensity analysis for each oocyte was conducted using ZEN (2012) software. NC, control group in which oocytes were not treated with NAC. 0.6mM, oocytes treated with 0.6mM NAC. Double star represents mean difference, p < 0.01. Data are expressed as mean ± SEM of at least 3 independent experiments, and 6 superovulated mice were killed to obtain a minimum of 40 oocytes for each experiment. (C) ROS relative fluorescent intensity in oocytes. The fluorescence intensity of oocytes which were cultured for 24h in the control group, was set as 100%. The y-axis represents the percentage of fluorescence intensity for each group compared to the group which was set as 100%. NC, control group in which oocytes were not treated with NAC. 0.6mM NAC, oocytes treated with 0.6mM NAC. Double star represents mean difference, p < 0.01. Data are expressed as mean ± SEM of at least 3 independent experiments, and 6 superovulated mice were killed to obtain a minimum of 40 oocytes for each experiment.

