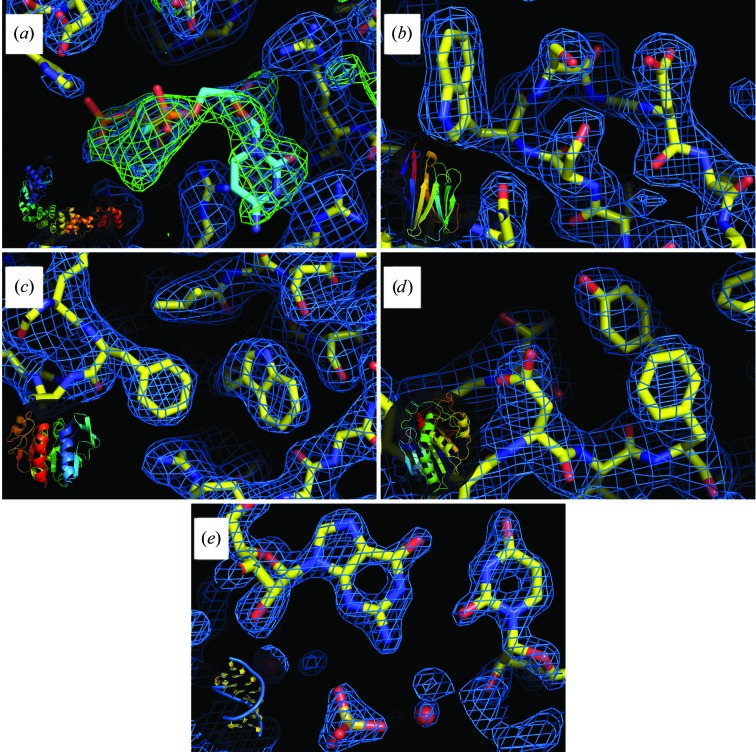
Figure 6.
Electron-density maps and structures of target macromolecules. (a) CCA-adding enzyme with the positive density from the ligand, (b) nanobody, (c) protease 1, (d) lipase, (e) RNA duplex. Insets: schematic representations of the whole macromolecules. This figure was prepared using PyMOL (v1.8.6; Schrödinger) with 2F o − F c electron-density maps (in blue) contoured at 1.2σ and the difference map (in green) contoured at 4σ.

