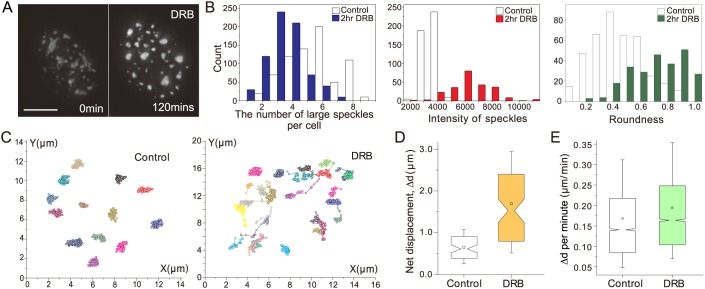
Fig. 1.
Inhibition of RNA polymerase II transcription by DRB changes speckle morphology and increases speckle mobility. (A) Changes in speckle morphology, visualized using GFP-SON, before and after DRB addition. Scale bar: 5 µm. (B) Measurement of speckle number (>1 μm in diameter) (left), intensity (middle) and roundness (right), before and after 2 h DRB treatment. Large speckles reduce in number (blue), and become brighter (∼2.5-fold, red) and rounder (1.5-fold increase in roundness, green) after DRB addition. (C) Speckle trajectories before and after DRB addition. Speckles, each assigned a different color, were tracked over a 1-h period in control (left) and DRB-treated (right) cells. (D) Net displacement (Δd) of speckles measured in control (white) and DRB-treated (yellow) cells. Speckle displacements increase after DRB addition (P=1.007×10⁻¹²; paired Student's t-test). Boxplots: boxes, mean (square inside box), median (notch of box), 25 (bottom) and 75 (top) percentiles; ends of error bars, 10 (bottom) and 90 (top) percentiles. n=75 speckles from ten control cells, n=80 speckles from ten DRB-treated cells from a single experiment. (E) Displacement (Δd) per minute increases from before (white) to after (green) DRB addition (P=2.2×10⁻¹⁶; paired Wilcoxon signed rank test). Boxplots as in D. n=4487 steps from 49 speckles (control), n=4375 steps from 50 speckles (DRB) from a single experiment.

