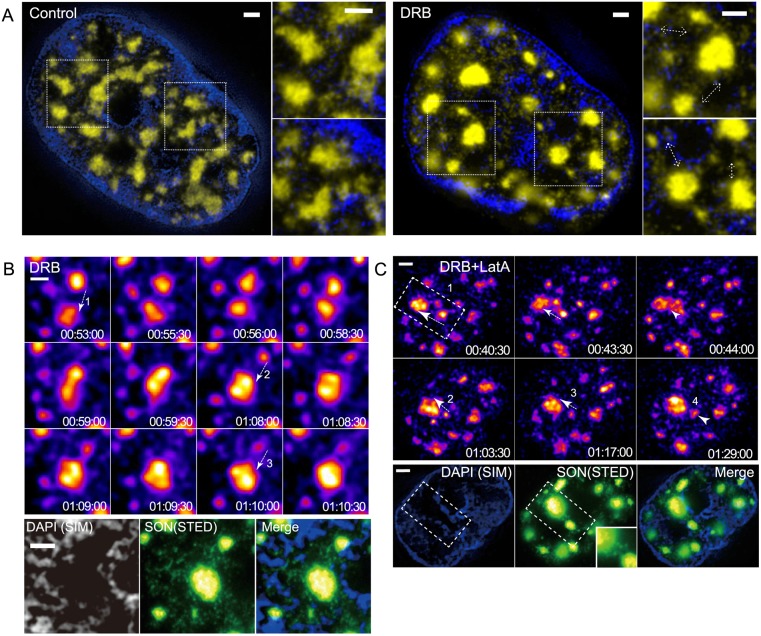
Fig. 7.
Repeated nuclear speckle motions occur within DAPI-depleted regions enriched in SON granules. Scale bars: 1 μm. (A) Correlative SIM (DAPI, blue) and STED (SON, yellow) images of single optical sections, showing heterogeneous distribution of nuclear speckles and SON granules in DAPI-poor regions before (left) and after (right) DRB treatment. Regions of interest are marked with dotted line boxes and shown enlarged in panels to the right of nuclear images. Dashed line arrows are drawn adjacent to local accumulations of SON granules running between two nearby nuclear speckles. (B) Correlation between the path of repeated speckle motions, DAPI-depleted region and local concentration of SON granules in a DRB-treated cell. Top: time-lapse images of repeated speckle motions. Each speckle motion is marked by a dashed line arrow and number. Time (h:min:s) is after DRB addition. See Movie 6. Bottom: correlative super-resolution images after fixation in the region of repeated speckle movements (see top) occurred in the DAPI-depleted region (left), enriched in SON granules (middle). The merged image is shown on the right. (C) Same as B but for DRB+latA-treated cell. See Movie 7.

