Figure 5.
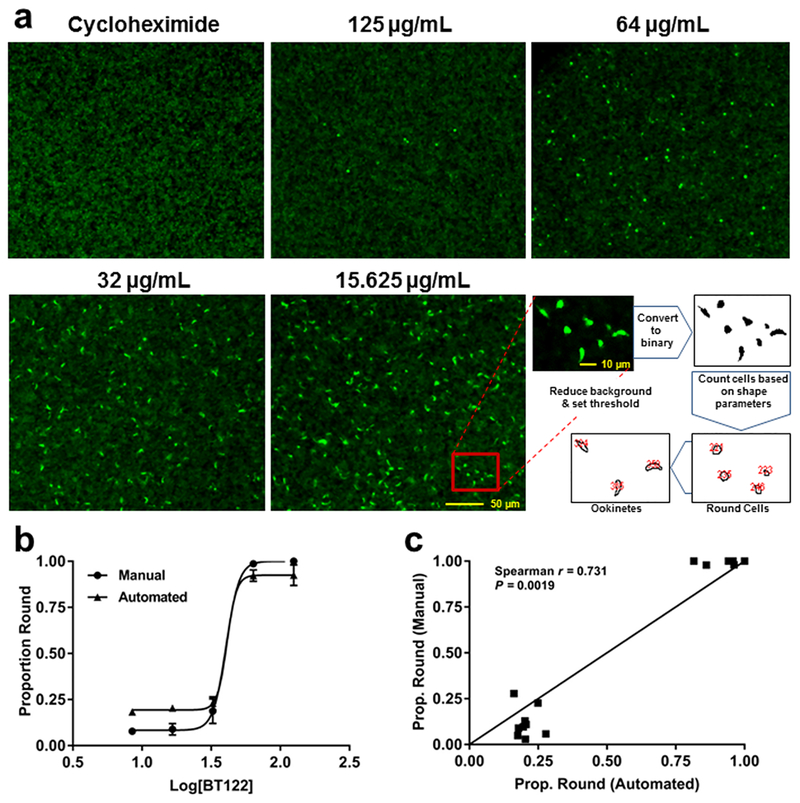
Automated counts of ookinetes and round cells yield similar proportions as manual counts. (a) Representative images from ookinete-development assays with P. berghei CTRP-GFP and a schematic showing how the automated counting program distinguishes between ookinetes and round cells. Cycloheximide was used as a positive control (loss of ookinete development) to determine background fluorescence. (b) Proportion of round cells plotted against concentration of BT122 on a log scale for both manual (circles) and automated (triangles) counts. Note that logistic curves fit to each data set yielded similar best-fit values for the Hill slope, 9.23 for manual (R2 = 0.9879) and 12.54 (R2 = 0.9827) for automated. (c) Proportion of round cells from manual vs automated counts of the same wells across three replicates (15 wells total) plotted against one another. A direct positive correlation would result in points falling on the line (slope = 1.0). The Spearman nonparametric test for correlation rejected the null hypothesis of no correlation between the methods. Taken together, the data in both panels suggest that automation reasonably approximates counting by eye but with opposite biases at each extreme. At high concentrations of BT122, automation tends to count a handful of false positive ookinetes, slightly reducing the proportion of round cells. At low concentrations of BT122, the program tends to overestimate the proportion of round cells due mostly to clumping of ookinetes or retorts that are counted as single parasites.

