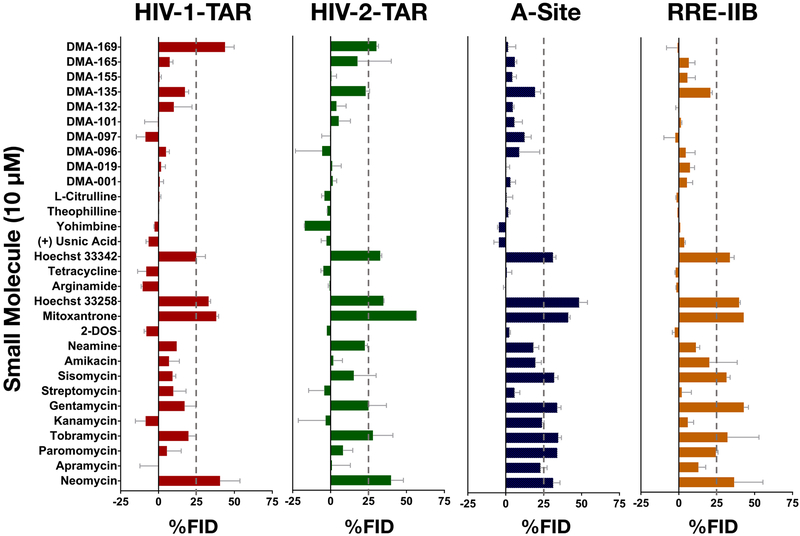
Figure 3:
Results of screening of 30 small molecules against HIV-1-TAR (Panel 1: Red), HIV-2-TAR (Panel 2: Green), A-Site (Panel 3: Blue), RRE-IIB (Panel 4: Orange) at 10 μM small molecule concentration. Conditions: 50 nM Tat-peptide; 40 nM HIV-1-TAR, 40 nM HIV-2-TAR, 120 nM A-Site, 75 nM RRE-IIB; 0, 10, 50 μM Small molecule; λ(Ex): 485 nm, λ(Em): 590 nm; Buffer: 50 mM Tris, 50 mM KCl, 5% DMSO, 0.01% Triton-X-100, pH = 7.4. %FID calculated using Equation 2 shown in the SI. See tables S4 and S5 and Figure S2 for other results of the Tat peptide displacement based screening experiments.

