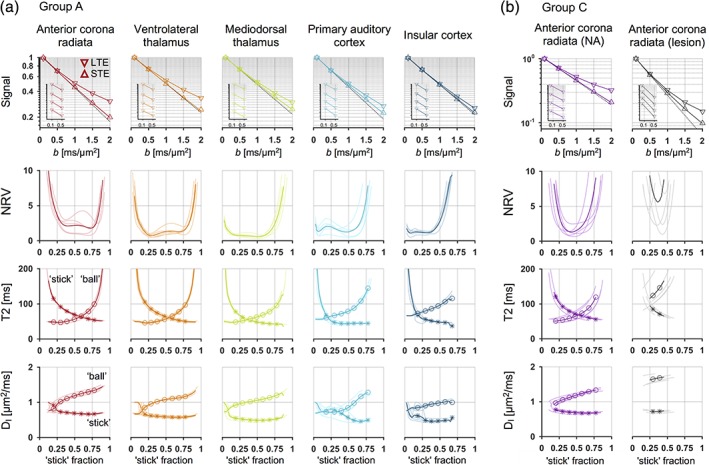
Figure 4.

Compartment densities could be estimated independently from T2 relaxation in white matter lesions, but not in the healthy brain. (a) In the healthy brain, different regions (sorted by column) exhibited rather different levels of microscopic anisotropy, as seen by the difference between the powder‐averaged LTE and STE signal curves (first row). The slopes of the signal curves for different TE (inset plots) revealed no clear echo‐time dependence of mean diffusivity (Equation (16)), however, and the regions were not clearly separable by the “stick” fraction of the minimally constrained model (Equation (5)). The goodness of fit plot (second row; Equation (18)) showed wide ranges of data‐compatible (fixed) “stick” fraction values, reflecting wide ranges of data‐compatible compartment‐specific T2 values (third row). For most “stick” fractions, however, the isotropic diffusivity was higher in the “ball” compartment compared to in the “stick” compartment (fourth row). (b) In white matter (anterior corona radiata) with a lesion, precise estimation of the “stick” fraction together with compartment‐specific T2 values was possible. The “ball” compartment featured a longer T2 value and a considerably higher isotropic diffusivity compared to the “stick” compartment, resulting in a sufficient echo‐time dependence of diffusion to yield a narrow range of data‐compatible “stick” fractions. The plots use shaded lines for individual subjects and thick lines for group‐averages [Color figure can be viewed at http://wileyonlinelibrary.com]
