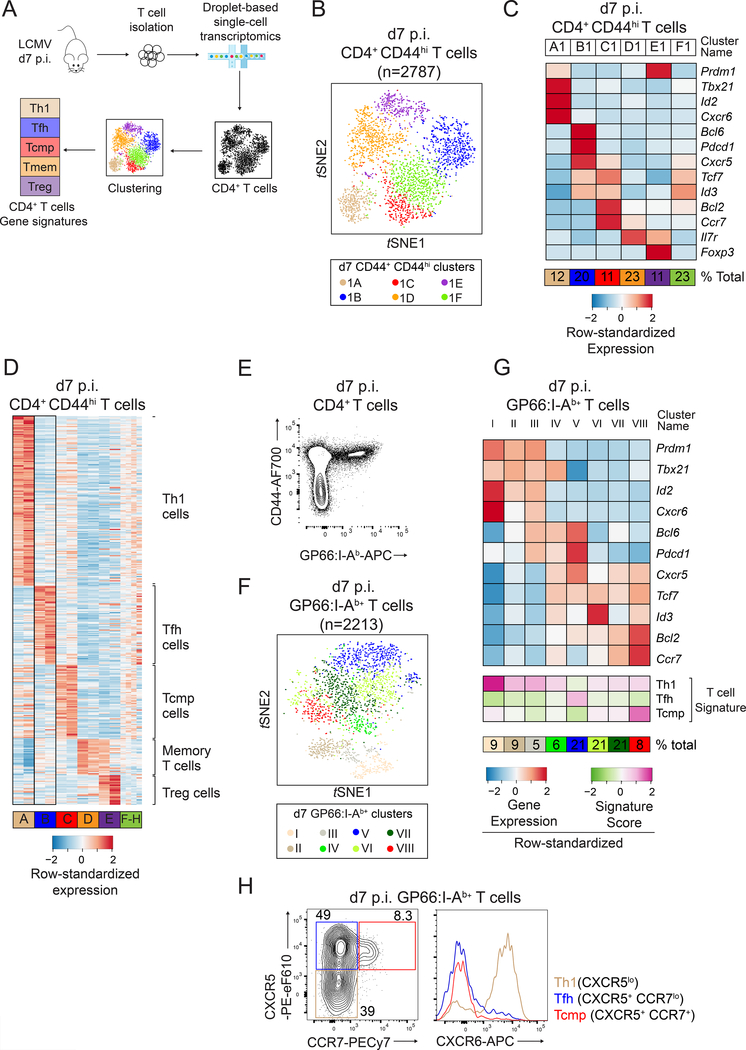
Figure 1: Identification of CD4+ T cell effector signatures by scRNAseq.
(A) Schematic of experimental procedures.
(B-D) scRNAseq of WT CD4+ CD44hi T cells at d7 p.i. LCMV. (B) t-SNE plot (experiment 1); each dot is a CD4+ T cell and colors highlight cell clusters. (C) Differential expression of select genes in clusters shown in (B). (D) Expression of signature components among CD4+ T cell clusters defined in both replicates (A-E, replicate 1 on left of each pair), or unique to each replicate (F-H).
(E-G) scRNAseq of d7 p.i. WT GP66:I-Ab+ CD4+ T cells. (E) Purification strategy. (F) t- SNE plot; colors highlight the 8 clusters. (G) Expression of selected genes and signature scores among clusters shown in (F).
(H) CCR7 vs. CXCR5 expression on spleen T cells (left) defines Th1-, TFH- and Tcmp-cell subsets, which are analyzed for CXCR6 expression (right). Data are from one representative experiment out of three. Please see also Figure S1.

