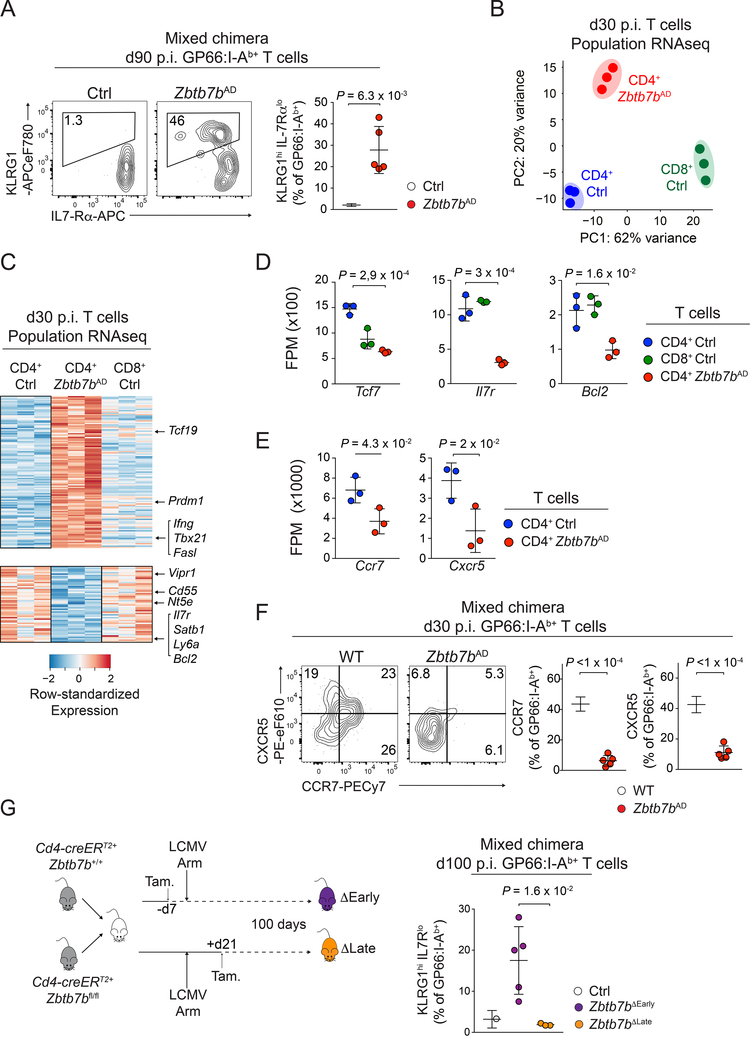
Figure 4: Early impact of Thpok on CD4+ T cell memory differentiation.
(A) Contour plots (left) and quantification (right, n=5 per group) of IL-7Rα and KLRG1 expression on GP66:I-Ab+ spleen T cells from Zbtb7bAD:WT or Ctrl:WT mixed bone marrow chimera, at d90 p.i. with LCMV Arm. Data are from one representative experiment out of two.
(B-E) RNAseq analysis of gene expression on GP66:I-Ab+ Zbtb7bAD (CD4 Zbtb7bAD) or control (CD4 Ctrl), and GP33:H-2Db+ (CD8 Ctrl) spleen T cells at d30 p.i. with LCMV Arm. (B) Principal Component Analyses (PCA). (C) Heat map of differential gene expression (as defined in Fig. S3F). (D, E) Expression (fragments per million, FPM) of selected genes in indicated populations. P-values are from one-way ANOVA. (B, D, E) each symbol represents a biological replicate.
(F) Contour plots (left) and quantification (right, n=5 per group) of CCR7 and CXCR5 expression on GP66:I-Ab+ spleen T cells from Zbtb7bAD:WT mixed bone marrow chimera analyzed at d30 p.i. with LCMV Arm. Data are from one representative experiment out of two.
(G) (left) Mixed bone marrow chimera (Cd4-creERT2+ Zbtb7bfl/fl: Cd4-creERT2+ Zbtb7b+/+) were infected with LCMV Arm after (ΔEarly) or 3 weeks before (ΔLate) tamoxifen treatment and analyzed at d100 p.i. (right) Percentage of KLRG1hi IL-7Rαlo cells among Thpok-deleted and Zbtb7b+/+ controls (from the same chimera) GP66:I-Ab+ spleen T cells (ΔEarly, n=4; ΔLate, n=3; Ctrl, n=7). Data are from one experiment and representative of 2 independent mixed bone marrow experiments and 3 similar experiments in non-chimeric mice; P-values from unpaired one-sided Welch’s t-test. Please see also Figure S3 and Figure S4.

