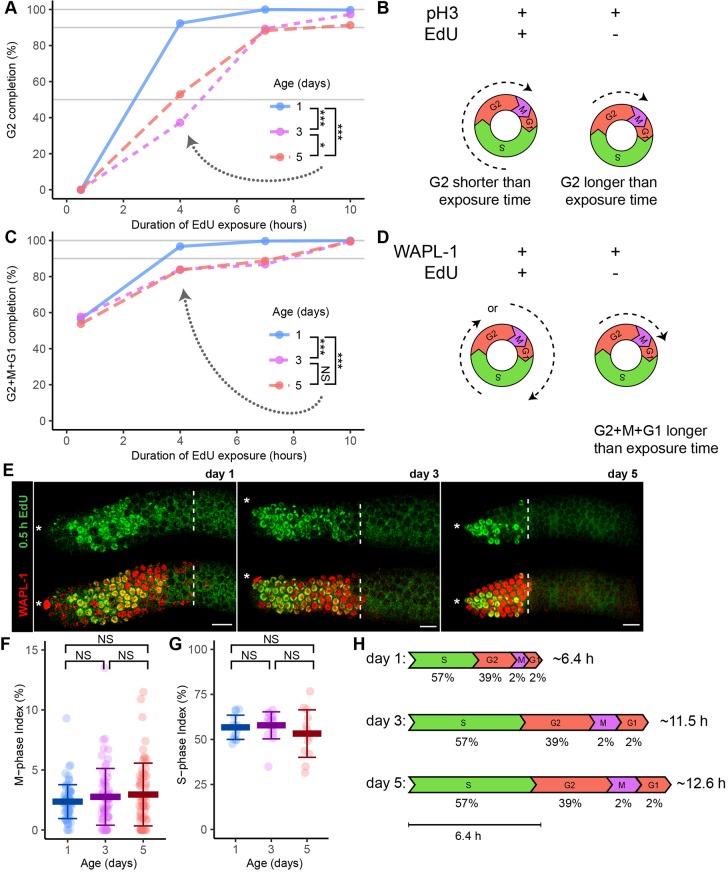
Fig. 4.
A population-wide age-related increase in the duration of the cell cycle. Mated hermaphrodites at day 1 (blue), 3 (purple) or 5 (red) were exposed to EdU for 0.5, 4, 7 or 10 h, and germlines were dissected and stained with anti-pH3 antibody, anti-WAPL-1 antibody and/or EdU click chemistry. (A) Percentage of G2 completion was defined as the number of cells that were both pH3 positive (indicative of M phase) and EdU positive (indicative of cell in S phase sometime during EdU exposure), divided by the total number of pH3-positive cells. These data were used to estimate the median time taken to complete G2 phase (n=1655 cells, 366 germlines). Gray horizontal lines indicate the 50th, 90th and 100th percentiles. A PC test was used to compare the 4 h time point (dotted arrow). (B,D) Dashed arrows in diagrams illustrate inferred cell cycle stage at the beginning (S or G2) and end (M, G1 or S) of the experiment. (C) Percentage of G2+M+G1 completion was defined as the number of cells that were both WAPL-1 positive (interpreted as being in the PZ) and EdU positive, divided by the total number of WAPL-1-positive cells. These data were used to estimate the maximum time taken to complete G2+M+G1 phase (n=31,958 cells, 193 germlines). Gray horizontal lines indicate the 90th and 100th percentiles. A PC test was used to compare the 4 h time point. (E) Representative fluorescence micrographs of one germline from adults exposed to EdU for 0.5 h and stained for EdU (green, top), and EdU and WAPL-1 (red, yellow overlap, bottom). Asterisks indicate DTC nucleus position; white dashed lines indicate the proximal boundary of WAPL-1-positive cells. Scale bars: 10 μm. (F) Each data point indicates the M-phase index (number of cells that were pH3 positive divided by the number of PZ WAPL-1-positive cells). (G) Each data point indicates the S-phase index (number of EdU-positive cells divided by the number of PZ WAPL-1-positive cells) of adults following an EdU exposure of 0.5 h (KW test). All data are mean±s.d. (See Table S4 for statistics.) (H) Scale diagrams illustrate the inferred duration of each cell cycle phase. Values below indicate the percentage; values on the right indicate total duration. Bar: 6.4 h. NS indicates P>0.05, *P<0.05, ***P<0.0001.

