Fig. 2.
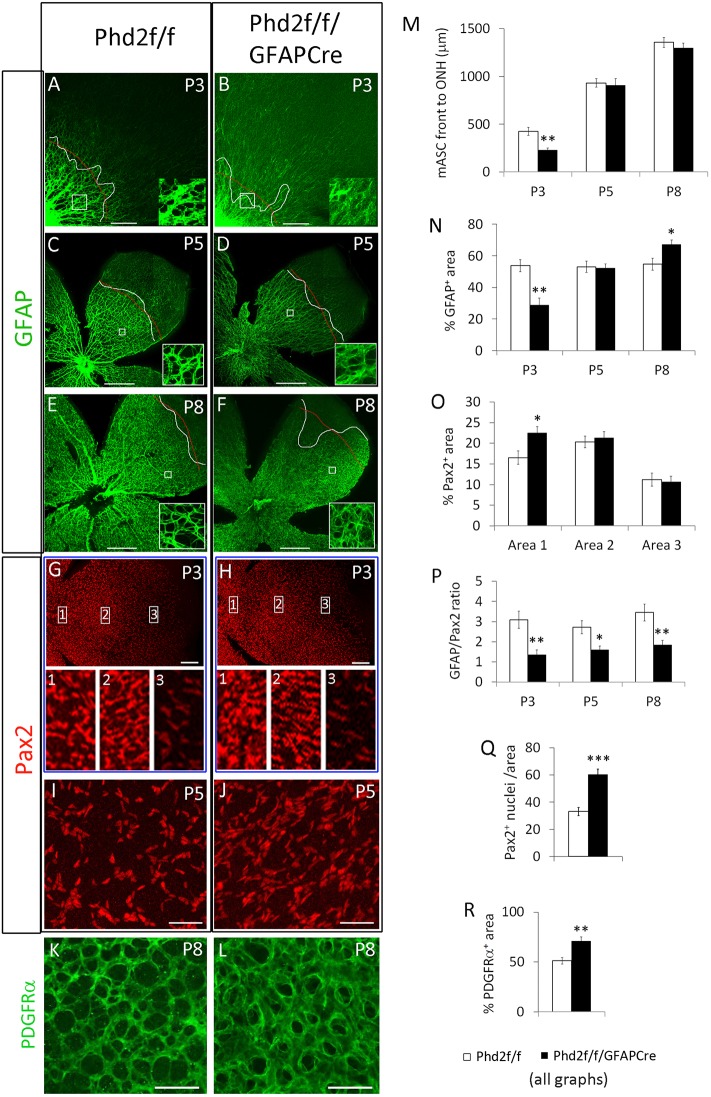
Astrocytic PHD2 deficiency suppresses astrocyte maturation in Phd2f/f/GFAPCre mice. (A-F) Flat-mount confocal images of anti-GFAP-stained mouse retinas at P3, P5 and P8. Curved white lines indicate mASC front. Thin red lines indicate approximate average positions of the mASC front. Insets show magnifications of the boxed areas. (G-J) Anti-Pax2-stained retinas. Insets 1-3 show magnifications of the boxed areas in G and H. Images in I and J are located midway between the ONH and retinal periphery. (K,L) P8 retinas stained with anti-PDGFRα. Images are from midway between ONH and retinal periphery. (M-R) Quantification of astrocyte development. (M) Distance from ONH to the mASC front. (N) % GFAP+ area, defined as percentage of an area (white boxes in A-F) occupied by GFAP+ pixels. (O) % Pax2+ area in areas 1-3, as indicated in G and H. (P) GFAP+/Pax2+ ratios. Quantification was carried out in areas similar to those indicated by white boxes in A-F. (Q) Number of Pax2+ nuclei per 0.02 mm2 area in P5 retinas. Quantification was done approximately midway between ONH and retinal periphery. (R) % PDGFRα+ area in K and L. n=6 mice/group. *P<0.05; **P<0.01. Scale bars: 200 µm (A,B); 500 µm (C-F); 200 µm (G,H); 50 µm (I-L).

