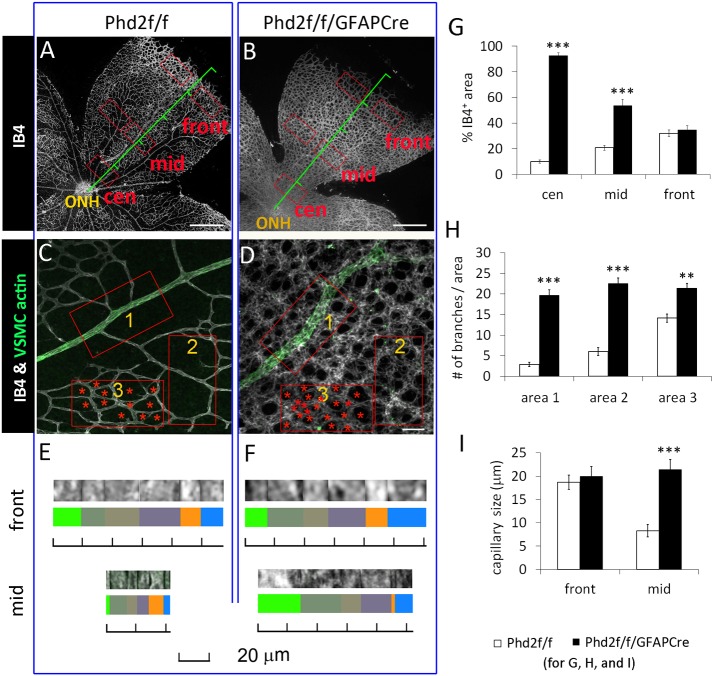
Fig. 3.
Increased retinal vascular density and capillary diameters in Phd2f/f/GFAPCre mice. (A,B) Laser confocal images of IB4-stained, flat-mount P8 retinas. Red rectangles labeled ‘cen’, ‘mid’ and ‘front’ represent central, mid-retinal, and vascular front areas, respectively. (C,D) Mid-retinal images from retinas double stained with IB4 and anti-actin α-smooth muscle-FITC. Rectangles 1, 2 and 3 indicate different positions relative to arterioles. Red asterisks in area 3 mark non-vascular tissues. (E,F) Determination of capillary sizes. For each measurement, six random capillary segments were aligned as shown, and the total distance from the left to right was divided by six to yield average of the set. (G) % IB4+ area at locations marked by red rectangles in A and B; where two rectangles are marked side by side, the average of each set of rectangles was used as one data point. (H) Vascular density (number of vascular branches per 0.02 mm2) in the areas1-3, as indicated in C and D. (I) Capillary sizes at two different retinal locations, near vascular front and mid-retinal area. n=7 mice/group. **P<0.01; ***P<0.001. Scale bars: 500 µm (A,B); 50 µm (C,D).

