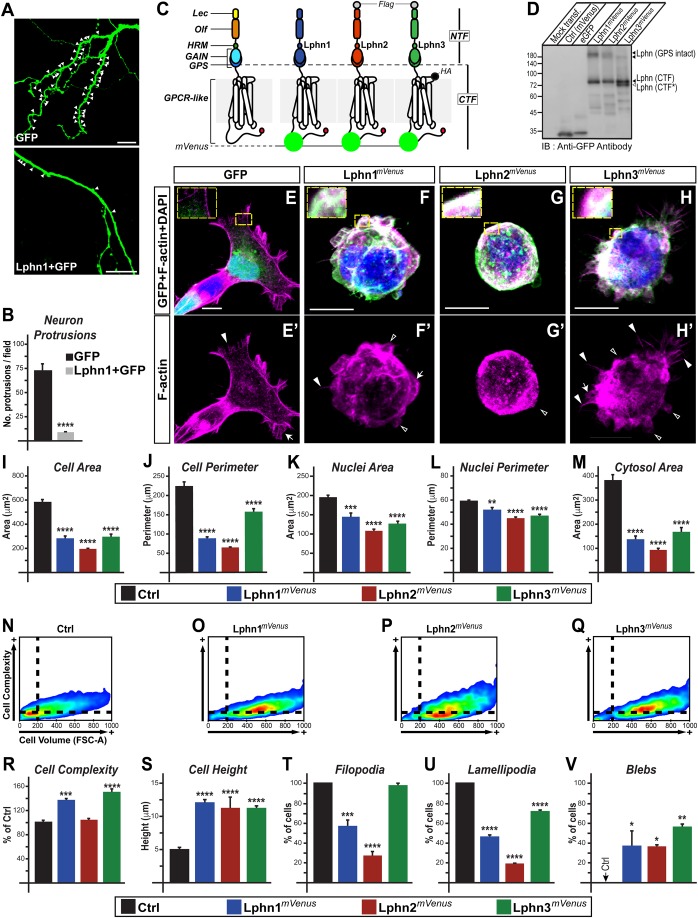
Fig. 1.
Latrophilins exert a cell-autonomous effect on cell morphology and the genesis of cell extensions. (A,B) Transfected hippocampal neurons expressing indicated proteins and quantification of neuronal protrusions; white arrowheads indicate sites of protrusions. (C) Schematic representation of LphnmVenus fusion proteins used in this study with HA and Flag epitopes where indicated: lectin (Lec), olfactomedin (Olf), hormone binding (HRM), GPCR auto-proteolysis inducing (GAIN), GPCR proteolysis site (GPS), N-terminal fragment (NTF), C-terminal fragment (CTF) and a PDZ-binding domain represented as the C-terminal red circle. (D) Cell extracts from HEK293T cells expressing the indicated proteins were analyzed by immunoblotting with an anti-GFP antibody. Lphn (CTF) and Lphn (CTF*) represent two fragments resulting from unknown post-translational modifications. (E–H') Confocal microscopy imaging analysis of fixed cells expressing LphnmVenus (in green) and stained for nucleus (DAPI, in blue) and F-actin (in magenta). Selected F-actin cell extensions are indicated: filopodia (filled arrowheads), lamellipodia (arrows) and blebs (hollow arrowheads). (I–M) Cell and nuclei dimensions as well as cytosolic area of transfected cells. (N–R) Flow cytometry analysis of cell complexity and volume for transfected cells (n=20,000). (S–V) Confocal microscopy analysis of cell height and population of cells displaying either filopodia, lamellipodia or blebs. Scale bars: 10 µm. Data, represented as mean values, were obtained from at least three separate experiments (neuron protrusion assays: n=22; confocal microscopy assays: Ctrl n=66, Lphn1mVenus n=27, Lphn2mVenus n=27, Lphn3mVenus n=30). Error bars indicate s.e.m. ****P≤0.0001, ***P≤0.001, **P≤0.01, *P≤0.05.

