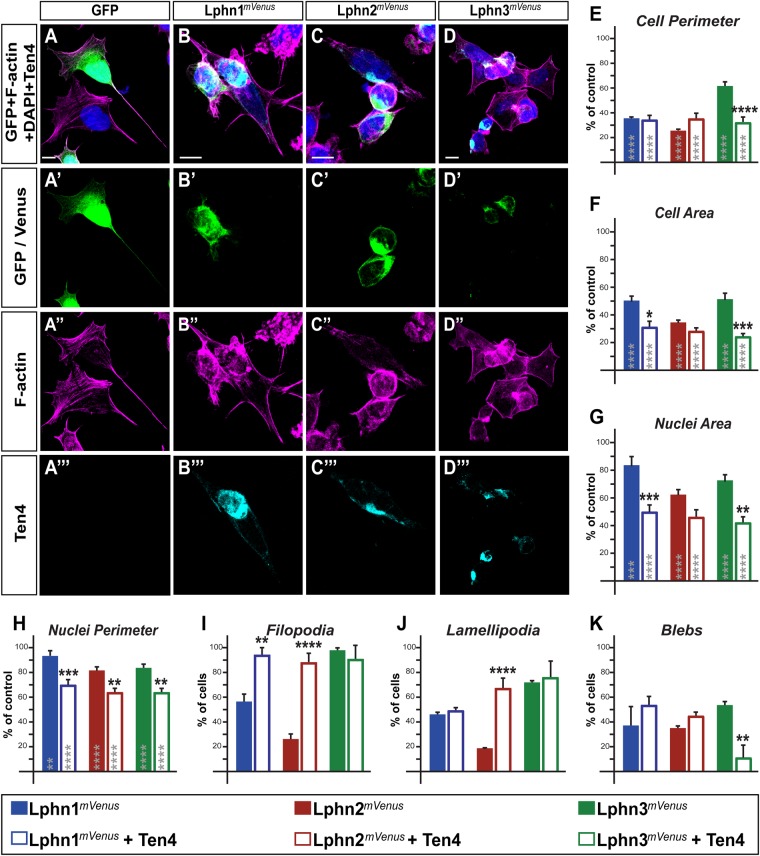
Fig. 3.
Intercellular adhesion established between Lphn- and Ten4-expressing cells leads to isoform-specific reversals of cell-autonomous phenotypes. (A–D‴) Cell aggregates displaying LphnmVenus expression (in green) were analyzed using confocal microscopy after staining for nuclei (in blue), F-actin (in magenta) and Teneurin-4 (in cyan). (E–H) Cell and nuclei dimensions of cells expressing the indicated proteins were plotted as a percentage of control mVenus-expressing cells values. (I–K) Percentage of cell population displaying indicated F-actin structures. Scale bars: 10 µm. Data, represented as mean values, were obtained from at least three separate experiments (Ctrl n=25, Lphn1mVenus n=27, Lphn1mVenus+Ten4 n=15, Lphn2mVenus n=27, Lphn2mVenus+Ten4 n=18, Lphn3mVenus n=30, Lphn3mVenus+Ten4 n=12). Gray asterisks indicate significance with control values from cells expressing mVenus. Error bars indicate s.e.m. ****P≤0.0001, ***P≤0.001, **P≤0.01, *P≤0.05.

