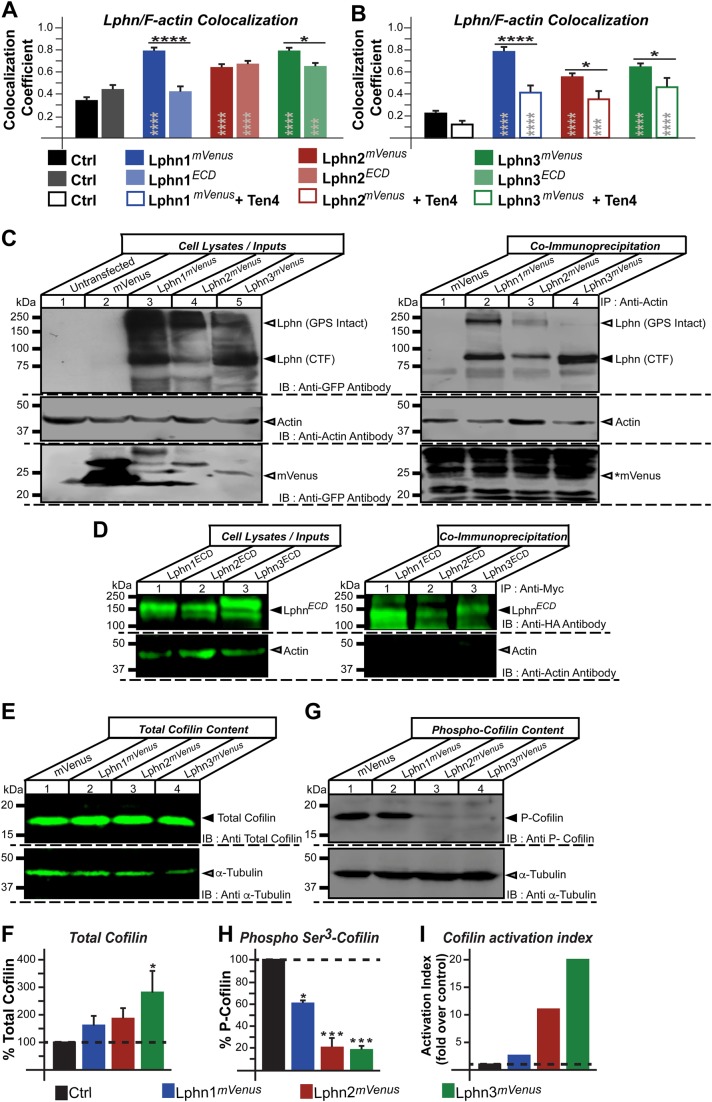
Fig. 4.
Latrophilins physically and functionally interact with the actin cytoskeleton of HEK293T cells. (A,B) Cells expressing the indicated constructs were imaged using confocal microscopy and analyzed for the presence of colocalized fluorescence pixels between LphnmVenus and rhodamine-phalloidin stained F-actin in isolates (A) or cell aggregates (B). (C) Immunoprecipitation of actin was conducted on extracts from HEK293T cells expressing the indicated LphnmVenus isoforms and subsequently probed for the presence of the receptors or mVenus control using an anti-GFP antibody or immobilized actin using an anti-actin antibody. Arrowheads mark the position of entities that were co-immunoprecipitated with actin (lane 2–4, right panel); asterisk indicates that the control mVenus protein could not be detected in the immobilized fraction despite its high expression (lane 2, left panel versus lane 1, right panel). Note the presence of bands representing Lphn receptors with the GPS intact in each lane corresponding to co-immunoprecipitated receptors (lane 2–4, right panel). (D) Immunoprecipitation using c-MYC antibody-coupled beads was conducted on cell extracts from HEK293T cells expressing the indicated LphnECD isoforms and subsequently probed for the presence of actin using an anti-actin antibody. (E,G) Cell extracts from HEK293T cells expressing LphnmVenus isoforms were probed with antibodies recognizing total cofilin (E) and phospho-cofilin (G), the inactive form of cofilin, along with an anti-α-tubulin antibody as a loading control. (F,H) Quantification of data obtained in E and G, respectively. (I) Cofilin activation index calculated by dividing total cofilin percentage by phospho-cofilin percentage for each indicated conditions. Data, represented as mean values, were obtained from at least three separate experiments involving 122 cells for microscopy assays in A and 116 cells in B. Gray asterisks indicate significance with control values from cells expressing mVenus. Error bars indicate s.e.m. ****P≤0.0001, ***P≤0.001, **P≤0.01, *P≤0.05.

