Fig. 1.
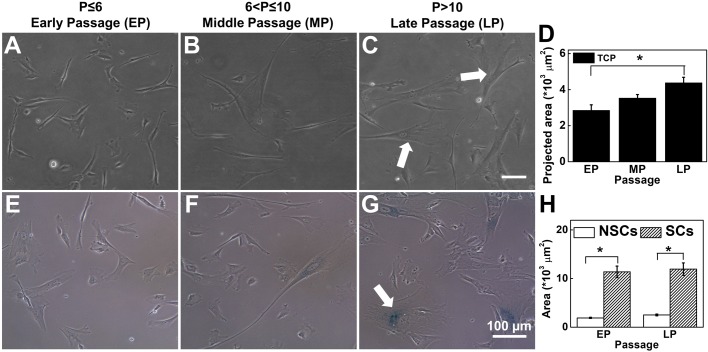
hMSCs lose their morphology and enter into replicative senescence on long-term passaging on TCP. Representative micrographs from (A) EP (passage number ≤6) (B) MP (passage number >6 and ≤10) and (C) LP (passage number >10) show that during in vitro expansion, MSCs lose their spindle morphology and become large and flat. White arrows show large cells with irregular shapes. (D) Over passage, average cell-spread area increases significantly from ∼3000–4500 µm2. (N=3, n=at least 150). (E–G) β-gal staining (a senescence marker) significantly increased in MP and LP cells compared to EP cells. White arrow indicates β-gal positive cells. (H) Spreading area of senescent cells and non-senescent cells: senescent cells have more spreading area than non-senescent cells, irrespective of passage (N=3, n>100). Results are expressed as mean±s.e.m., *P<0.05. Scale bars: 100 µm.

