Fig. 7.
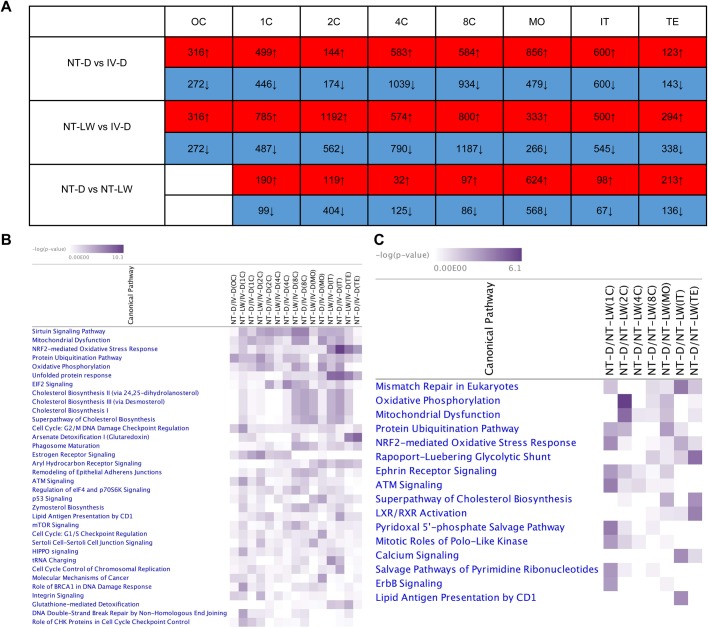
Comparison of gene expression levels and associated pathways between the cloned and in vivo fertilized embryos from the 25-sample dataset. (A) The number of DEGs between each developmental stage of NT-D, NT-LW and IV-D embryos. (B) Over-representation of IPA canonical pathway annotation terms for DEGs between the cloned and in vivo embryos where the criterion for statistical significance was P-value<0.0001. (C) Over-representation of IPA canonical pathway annotation terms for DEGs between Laiwu and Duroc cloned embryos at each cleavage stage. Criterion for statistical significance was P-value<0.001.

