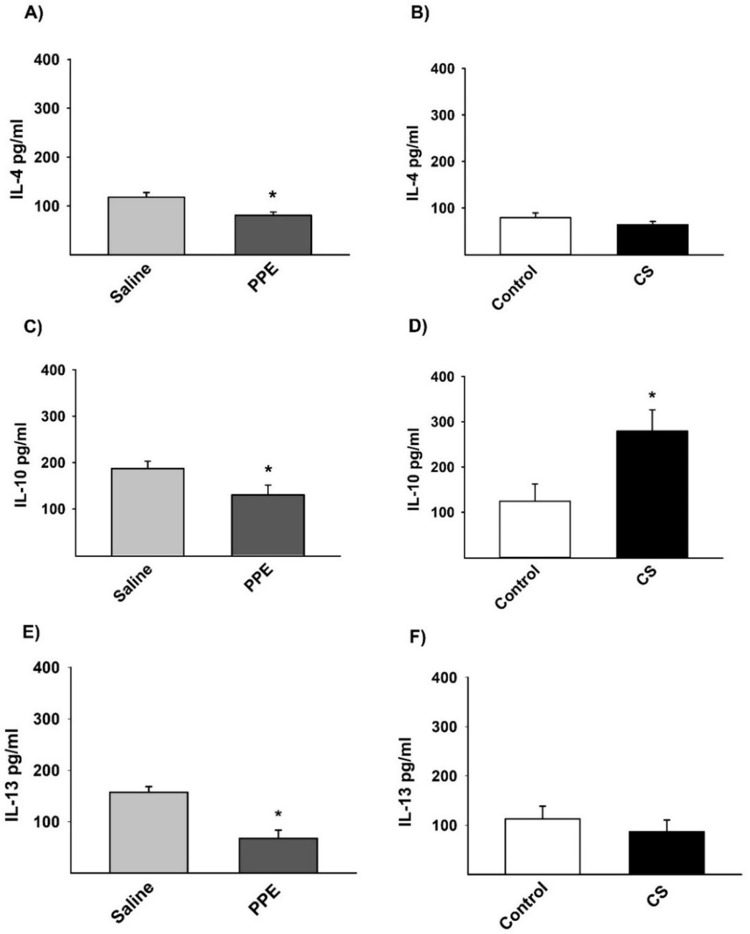
Fig. 9.
Protein quantification of IL-4 (A,B), IL-10 (C,D), and IL-13 (E,F) by ELISA. (A) *P=0.016, (C) *P=0.046, (D) *P=0.028, (E) *P=0.007, compared to their respective controls. Values are expressed as the mean±s.e. IL-4: saline n=10; PPE n=9; control n=8; CS n=6. IL-10: saline n=7; PPE n=8; control n=6; CS n=6. IL-13: saline n=6; PPE n=9; control n=6; CS n=7.

