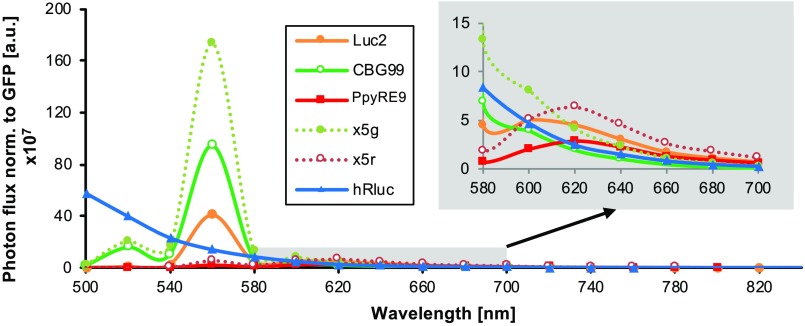
Fig. 1.
Comparison of Luc2, CBG99, PpyRE9, x5g, x5r, and hRluc emission spectra in vitro. Plotted is the photon emission from -luciferase-T2A-copGFP transfected HEK 293T cells recorded with the IVIS Spectrum CT system (mean of to 6). Photon emission has been normalized to the individual copGFP expression. Graph with gray background is a zoom-in for 580 to 700 nm to highlight the differences in the red part of the spectra.

