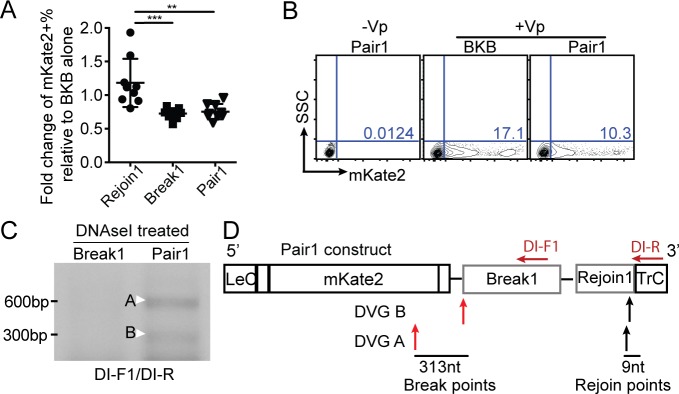
Fig 3. Identification of one conserved genomic region critical for cbDVG rejoin.
(A-B) BSR-T7 cells were co-transfected with all 4 helper plasmids as well as BKB or constructs with candidate signal sequences. mKate2 expression was measured by flow cytometry. The quantification of all repeats is shown as a fold change expression over BKB in A (F test P<0.0001). **p<0.01, ***p<0.001 by one-way ANOVA Bonferroni’s multiple comparison test, n = 8 and all replicates are independent experiments, mean±SEM, Bartlett’s test is used for examination of equal variance. Flow gating strategy is shown in S2A Fig. Representative flow plots are shown in B. (C-D) cbDVG-like fragments formed in Pair1 were detected by RT-PCR using DI-F1 and DI-R primer sets (S1 Table). A representative gel picture is shown in C. Bands labeled with a white arrow were confirmed to correspond to cbDVG by conventional sequencing. Their sequence is shown in S3A Fig. (D) Location and sequence length between the break and rejoin points are indicated in panel by red and black arrows, respectively. The position of the primer set (DI1/DI-R) used to detect cbDVGs in this experiment is indicated on top of the construct map.

