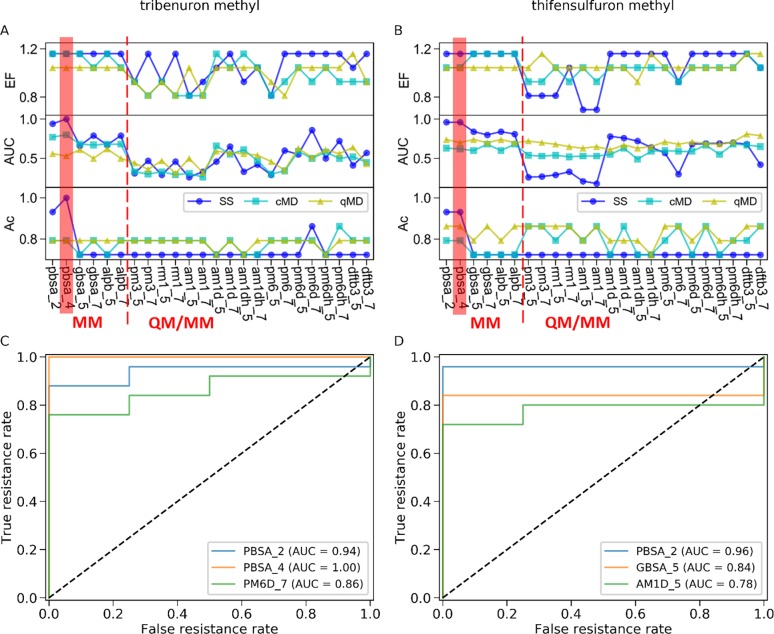
Fig 4. Prediction performance of 24 binding affinity estimation methods in combination with three conformational sampling strategies evaluated by EF, AUC, and accuracy (Ac).
(A) Performance metrics for prediction on resistance to tribenuron methyl. (B) Performance metrics for prediction of resistance to thifensulfuron methyl. (C) The top three ROCs for tribenuron methyl. (D) The top three ROCs for thifensulfuron methyl. PBSA_2/4 is the MM-PBSA with ε of 2 or 4. The GBOBC and GBn models are represented by 5 and 7, respectively. Binding affinity was computed on the basis of single structure minimized (SS), structures sampled from classical MD simulations (cMD), or structures extracted from QM/MM MD simulations (qMD).

