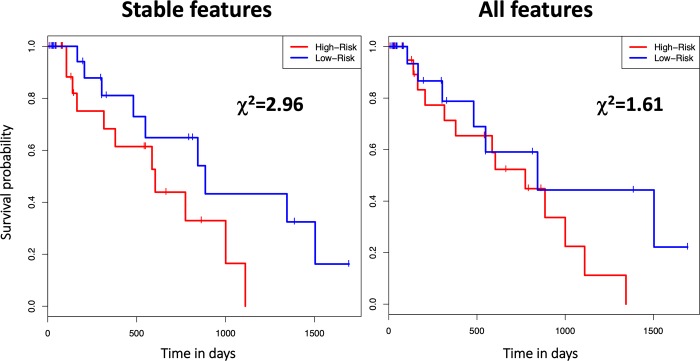
Fig 6. Kaplan-Meier survival curves of an example bootstrapping round to compare the 4D pre-selection model with the optimal cutoff (4D COV≤5%) and the corresponding model without 4D stability pre-selection.
For each case, the Kaplan-Meier survival curves are shown to compare the overall survival of the model predicted low- and high-risk groups based on the median risk score. The χ2 value from the logrank test comparing the two risk groups is also shown.

