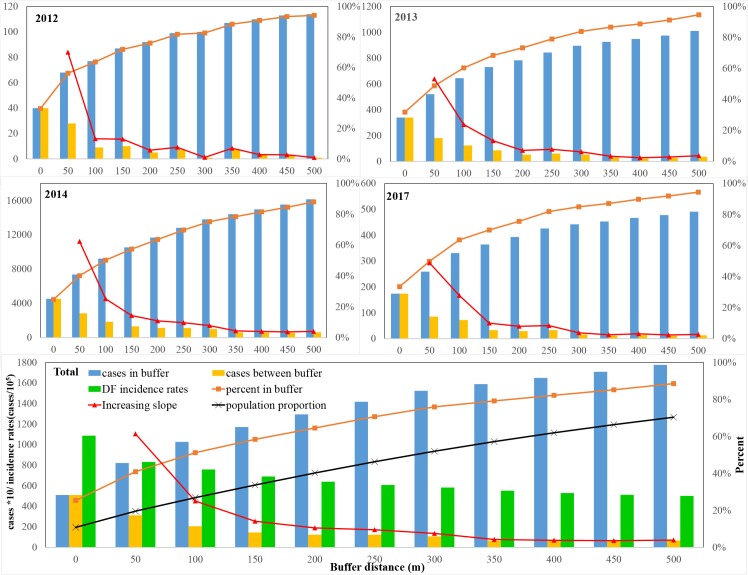
Fig 5. The aggregation effect of UVs on the DF cases across the central region in Guangzhou City.
AVG is the average results of four years. Cases in buffer represent that DF cases count in different buffer radius. Cases between buffer indicate the number of DF cases between different buffer zones. Percent in buffer indicate the proportion of DF cases in different buffer radius. Increasing slope indicate the increasing rates of DF cases in different buffer radius.

