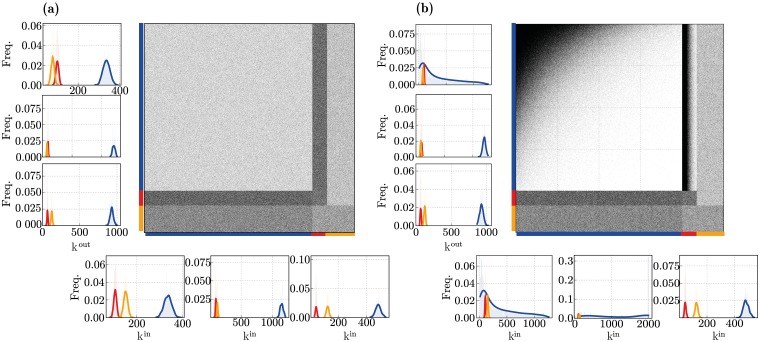
Fig 3. Microcircuit connectivity for (a) homogeneous and (b) heterogeneous network structures.
The large panels show the circuit’s complete connectivity matrix Asyn, comprising all connections among all neuron classes. The panels on the left sides show the corresponding out-degree (kout) distributions for the neuronal populations (E, I1 and I2 from top to bottom); the panels at the bottom show the corresponding in-degree (kin) distributions (E, I1 and I2 from left to right).

