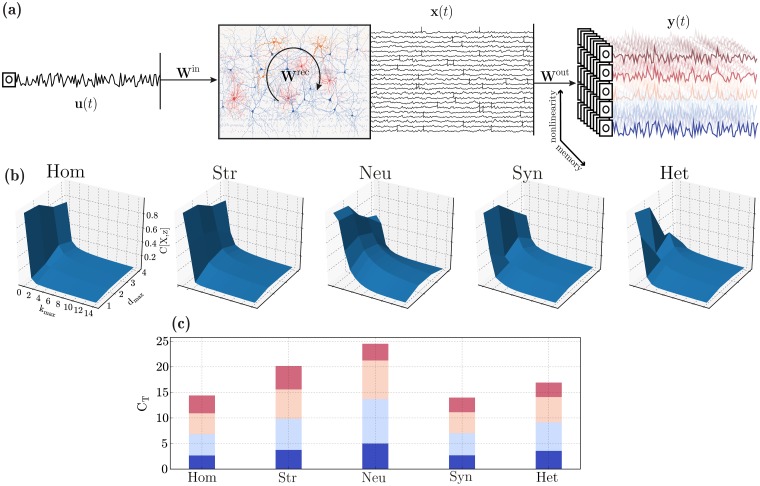
Fig 8. Computational capacity in the different heterogeneity conditions.
(a) Illustration of the setup used to assess computational capacity. An input signal, u, is used to drive a sub-set of E neurons and the population responses, x, are recorded and gathered in state matrix X. These states are then used to reconstruct a set of time-dependent functions z = f(u−k). These target functions vary in complexity (degree of nonlinearity, color-coded) and memory requirements. (b) Normalized capacity space, i.e. ability to reconstruct functions of u at different maximum delays (kmax, memory) and degrees (dmax, complexity/nonlinearity). For any given function, the capacity is normalized such that C[X, z] = 1 corresponds to perfect reconstruction of z. (c) Total processing capacity, expressed as the sum of all capacities for a given degree (the incremental color code in each bar corresponds to the maximum degree for each segment, varying from 1 to 4 and is also illustrated in (a)).

